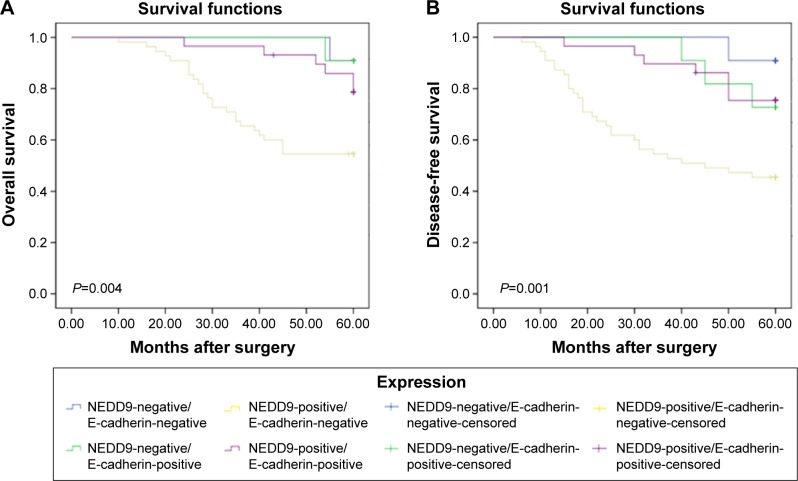
Figure 3.
Kaplan–Meier curve with univariate analyses (log-rank) for patients with NEDD9-positive/E-cadherin-negative, NEDD9-negative/E-cadherin-positive, NEDD9-positive/E-cadherin-positive, and NEDD9-nagative/E-cadherin-positive.
Notes: (A) OS curve of TNBC patients based on coexpression of NEDD9 and E-cadherin. (B) DFS curve of TNBC patients based on coexpression of NEDD9 and E-cadherin. All P<0.05.
Abbreviation: NEDD9, neural precursor cell expressed, developmentally downregulated 9.

