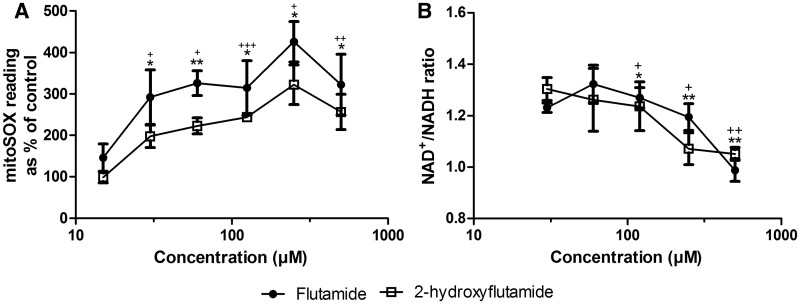
FIG. 9.
The effect of flutamide and 2-hydroxyflutamide exposure on superoxide levels (A) and NAD+/NADH ratio (B) in HepG2 cells (2 h). Serial concentrations of compounds were used up to 500 µM. Statistical significance compared with vehicle control; flutamide; * P <.05; ** P <.01; *** P <.001, 2-hydroxyflutamide; + P <. 05;++ P < .01; +++ P < .001. mitoSOX results were normalized to µg protein per well. Data are presented as mean ± SEM of n = 3 experiments.

