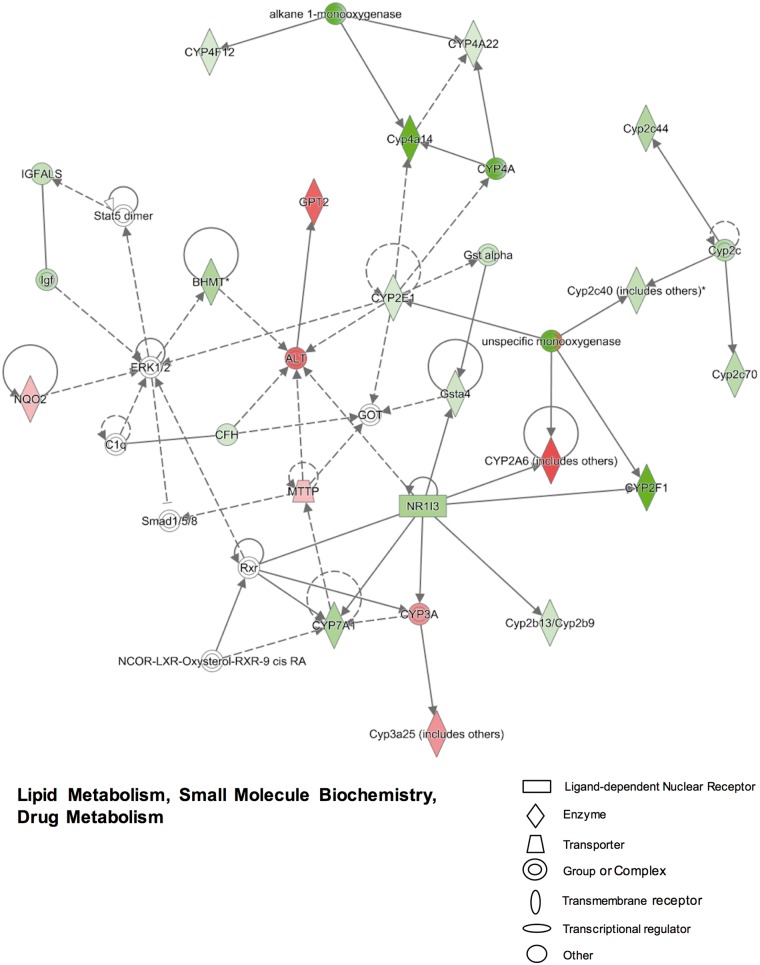
FIG. 2.
Ingenuity pathway analysis (IPA) identified networks associated with gene expression changes that were uniquely regulated by pregnenolone-16α-carbonitrile (PCN) compared with corn oil at 3-day of age in livers of wild-type (WT) mice (>2-fold change, adjusted P < 0.05). More networks are shown in Supplemental Figure 1. Genes or gene products are represented as nodes. The intensity of the node color indicates the degree of up-regulation (red) or down-regulation (green). The edges (lines and arrows between nodes) represent direct (solid lines) and indirect (dashed lines) interactions between molecules as supported by information in the Ingenuity knowledge base. Node shapes represent functional classes of gene products.

