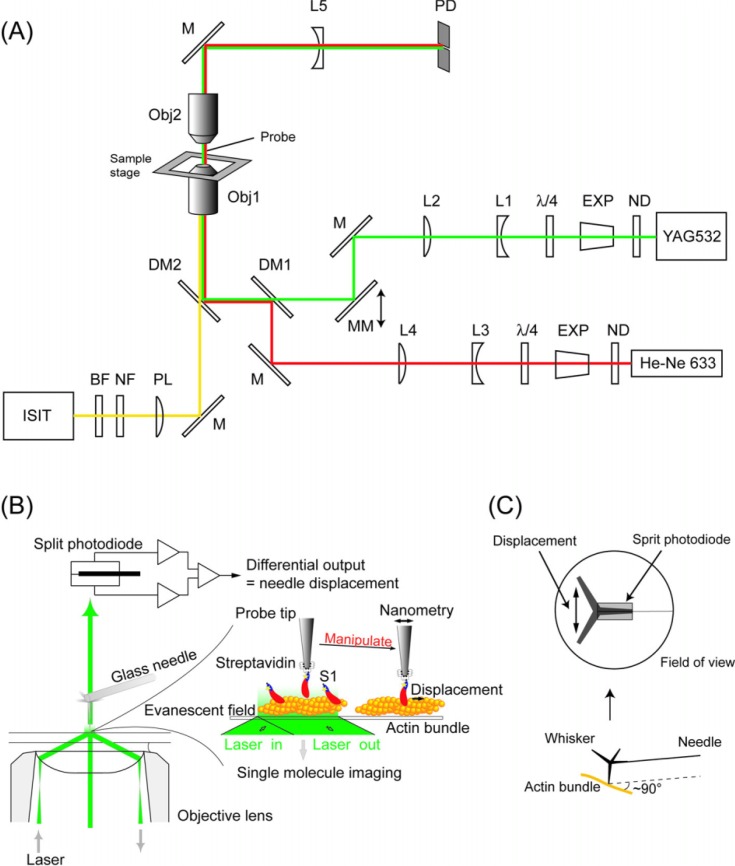
Figure 1.
(A) Schematic drawing of the experimental apparatus. The system was built on an inverted microscope. A green laser (YAG532) was used as the light source for both single molecule imaging (objective-type TIRFM) and nanometry (bright field illumination) by changing the incident angle of the laser by moving the mirror, MM. The fluorescent image of single Cy3-BDTC-S1 molecules was collected by the lower objective (Obj1), magnified by a projection lens (PL), and detected by an intensified-SIT camera (ISIT) under TIR illumination mode. The magnified image of the probe was obtained by the upper objective (Obj2) and a concave lens (L5) under bright field illumination mode. Displacement of the needle was monitored using a split-photodiode (PD). The red laser (He-Ne 633) was used for monitoring the probe position during single molecule manipulation (See text for details). ND, neutral density filters; Exp, beam expanders; λ/4, quarter-wave plates; L1&3, concave lens; L2&4, convex lens; DM1&2, dichroic mirrors; NF, notch filter; and BF, bandpass filter. (B) Imaging and nano-manipulation of single S1 molecules. A single S1 molecule, which had been biotinylated and fluorescently labeled by Cy3 at its regulatory light chain, was specifically attached to the tip of a scanning probe through a biotin-streptavidin bond and observed as a single fluorescent spot. The displacement produced when the S1 molecule was brought into contact with an actin bundle bound to a glass surface in the presence of ATP was determined by measuring the position of the needle with sub-nanometer accuracy. The S1 was rigidly attached to a fairly large scanning probe, so it was assumed to stably interact with an actin filament without diffusing away just like in muscle. (C) The schematics of the measurement geometry. A ZnO whisker crystal, whose length was 5–10 µm and radius of curvature of the tip was ∼15 nm, was attached to the tip of a very fine glass microneedle, 100 µm long and 0.3 µm in diameter. The glass needle was set perpendicular to the longitudinal axis of the actin bundle (Lower). The magnified image of the whisker + needle was projected onto the split-photodiode to measure the nanometer displacement (Upper).

