Computer simulation of multiple head cooperative activity undergoing stochastic steps. We simulated cooperative action of myosin heads under a periodic and asymmetric potential as shown in
Fig. 11B by numerically solving the Langevin equation,
where
xi is the position of
i-th myosin head; ρ is a drag coefficient;
F(
t) is the random force obeying a Gaussian white noise characterized by the ensemble average, <
F(
t)>=0 and <
F(
t)
F(
s)>=2
kBTδ(
t−
s);
Ai is the interaction force between the neighboring heads described as κ(
xi−
xi−1)−κ(
xi+1−
xi), where κ is the spring constant connecting the heads. The potential slope along the actin helical pitch (
Fig. 10B) was simplified to be a straight saw-tooth shaped potential. Instead, the drag coefficient was set to be larger than it is in solution so that the velocity of the heads was equal to the maximum velocity in
Fig. 7. Other parameters were chosen such that 1) the spring constant (κ) connecting the head was 0.1 pN/nm, which is approximately one tenth as large as that of a rigor crossbridge; 2) the ratio of potential rise to decline was 1 to 6 and the depth of the potential at the bottom was 2
kBT; 3) the pitch of the potential and the average intervals of myosin heads were 36 nm and 43 nm, respectively; 4) the number of heads interacting with the actin filament was 11 (∼20% overlap between actin and myosin filaments); 5) the rotation angle of the actin filament was 90°; and 6) the rate constant (
k+) that the heads rebind to actin after the rewinding of the actin filament was 100 s
−1head
−1. The potential slope was assumed to be smaller than that estimated in the present experiment (see
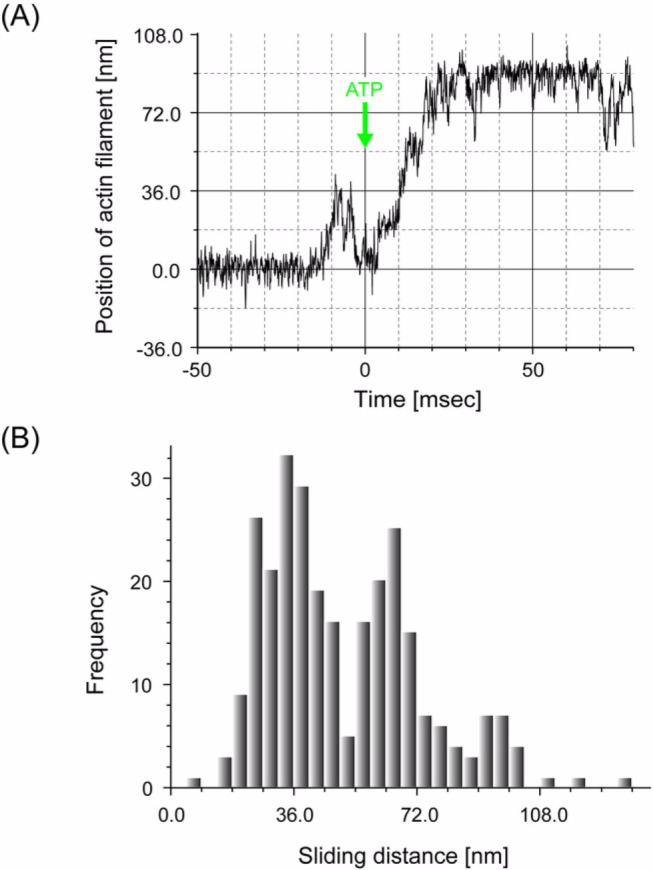
Fig. 10). The strain exerted on the neck domain would be much smaller during free shortening at zero load in muscle because the head is tethered to the myosin filament via a flexible α-helix (S2), while the head is directly attached at its tail end to the probe in the present measurement system. Thus, the potential slope depending on the strain would be smaller. (A) A typical time course of the movement of an actin filament. (B) Histogram of the sliding distance of actin filaments per ATP. The average sliding distance of actin filaments was 58.4 nm per ATP.

