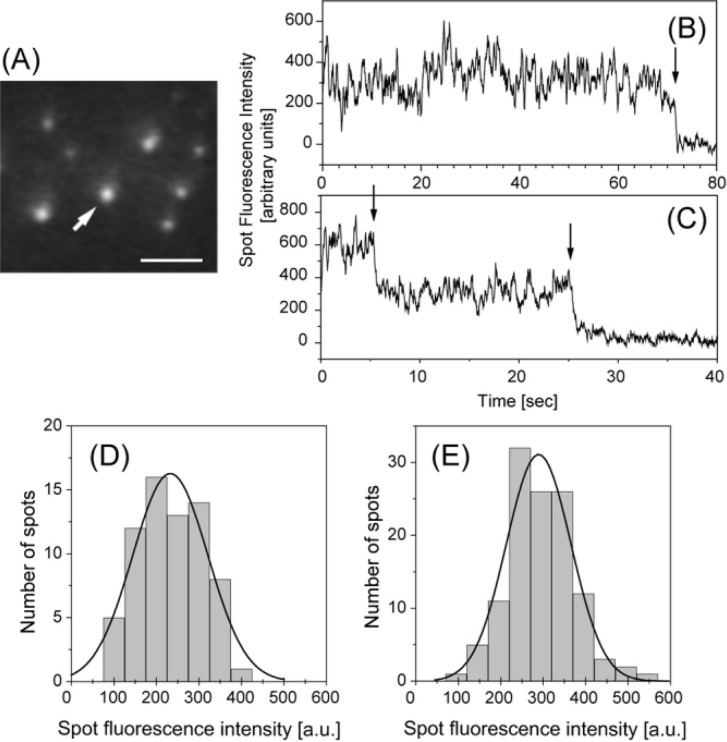
Figure 2.
Imaging of single Cy3-labeled S1 (Cy3-BDTC-S1) molecules captured on the tip of the scanning probe under TIRFM. (A) Fluorescence image of a Cy3-BDTC-S1 molecule captured on the tip of the probe (arrow). The S1 molecules were clearly observed as fluorescent spots. Bar=5 µm. (B and C) Typical time trajectories of the fluorescence intensity of a single (B) and double (C) Cy3-BDTC-S1 molecule captured onto the tip of the probe. Arrows indicate photo-bleaching. (D and E) Distributions of fluorescence intensities from Cy3-BDTC-S1 captured onto the tip of the probe (D) and adhering to the glass surface (E) were well fitted with Gaussian distributions centered at 230±88 and 290±76 (mean±s.d.), respectively.

