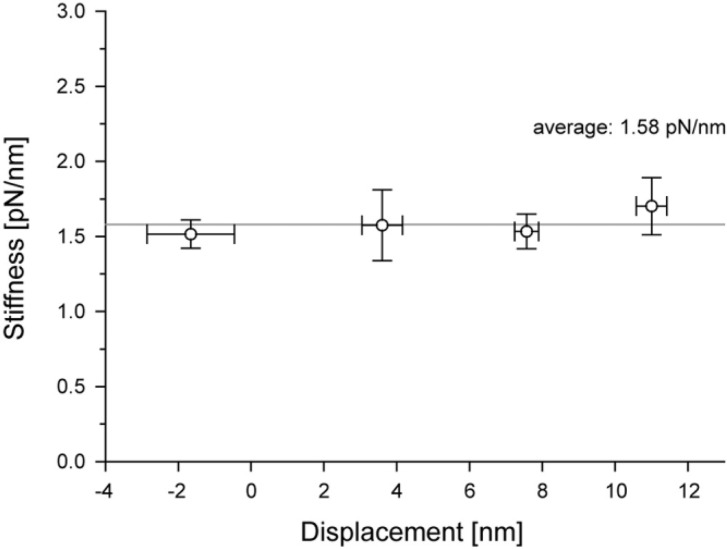
Figure 4.
Stiffness during the attachment of an acto-S1. The system stiffness was measured for individual displacements and the mean vaules were plotted against the plateau levels of displacements (see Fig. 1A). The data represents mean±s.e.m. Note that the system stiffness is constant over the range of displacement observed.

