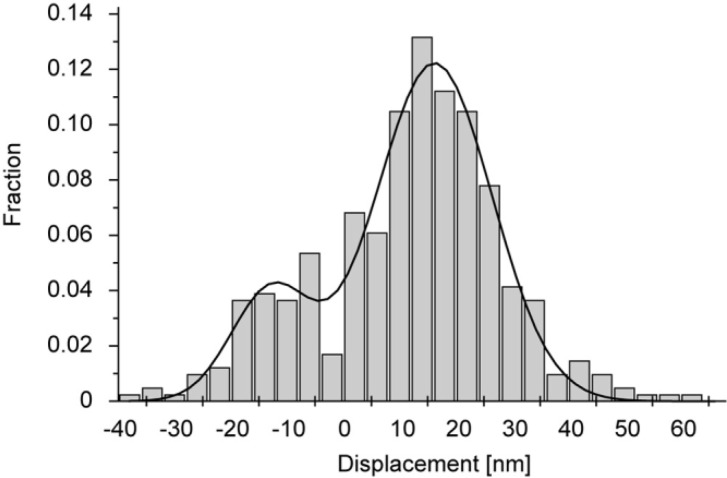
Figure 5.
A histogram of needle displacements caused by single S1 molecules at low needle stiffness (n=135). The solid line indicates a double Gaussian with peaks at 14 nm and −13 nm fit to the data. The standard deviation of each Gaussian was similar to that of the thermal vibration of the needle used in solution.

