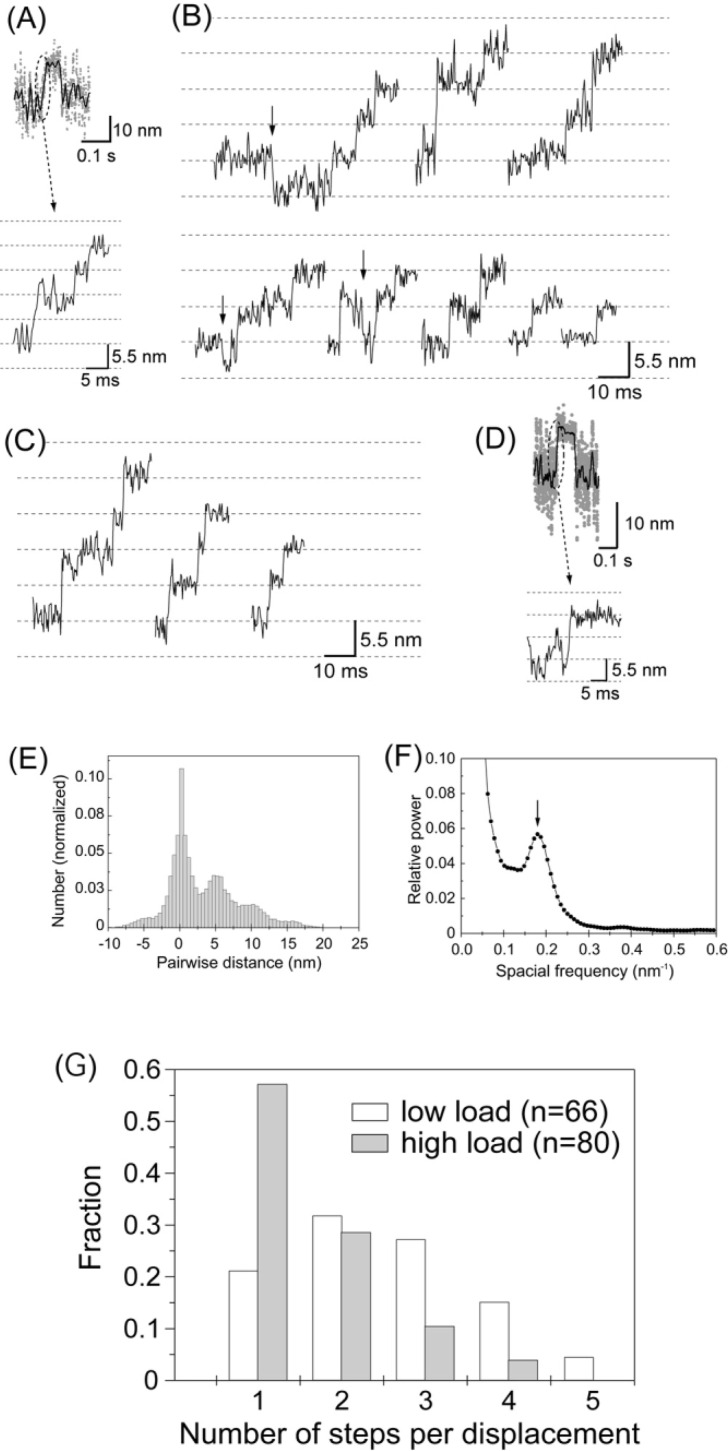
Figure 6.
Stepwise movements in the rising phase of the displacements. (A) The rising phase of the displacement record plotted on an expanded timescale. (B) Representative traces of stepwise movements in the rising phase at high needle stiffness (2 kHz bandwidth). Some backward steps were observed as indicated by arrows. (C) Stepwise movements in the rising phase at low needle stiffness (0.01–<0.1 pN/nm) from Kitamura et al.29. (D) The rising phase of the displacement that took place so rapidly that the steps were unclear. (E) Histogram of the pairwise distance for all the data points of stepwise movements in the rising phase at high needle stiffness (number of rising phases=80). (F) Power spectrum of the histogram of pairwise distance shown in (E). An obvious peak was observed at 0.18 nm−1 corresponding to the spatial periodicity of 5.6 nm in the histogram. (G) Histogram of the number of steps per displacement. The steps were counted by eye. Steps of ∼5.5×N nm were counted as N steps. White and gray bars indicate the results obtained at low and high needle stiffness, respectively.

