Figure 7.
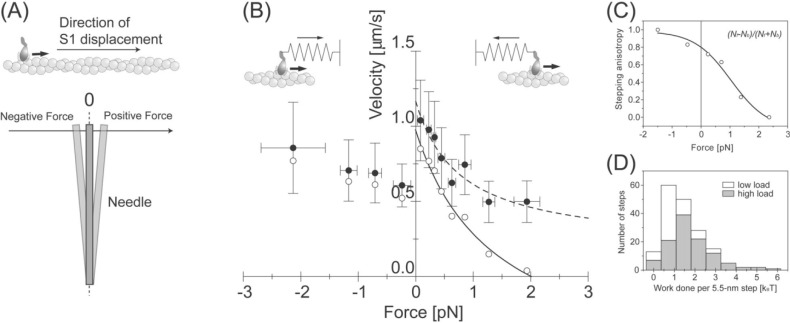
Load dependent properties of the 5.5-nm steps. (A) The definition of the direction of the forces. When the S1 was pulled by the needle against its proceeding direction, determined by the direction of major displacement as shown in Fig. 4, the force was defined as positive. (B) Force-velocity curve of individual S1 molecules. The velocity was obtained by dividing the step size, 5.5 nm, by the dwell time (Filled circles). Bars indicate the standard deviations for 10–30 steps. Open circles indicate the velocity corrected by the anisotropy of the stepping direction. The solid line shows the Hill’s curve fitted to the corrected velocity. (C) Load dependence of the stepping anisotropy. (D) Histogram of work done by each 5.5-nm step at low (white bars) and at high needle stiffness (gray bars). Average work done per 5.5-nm step at higher needle stiffness was 1.8 kBT.

