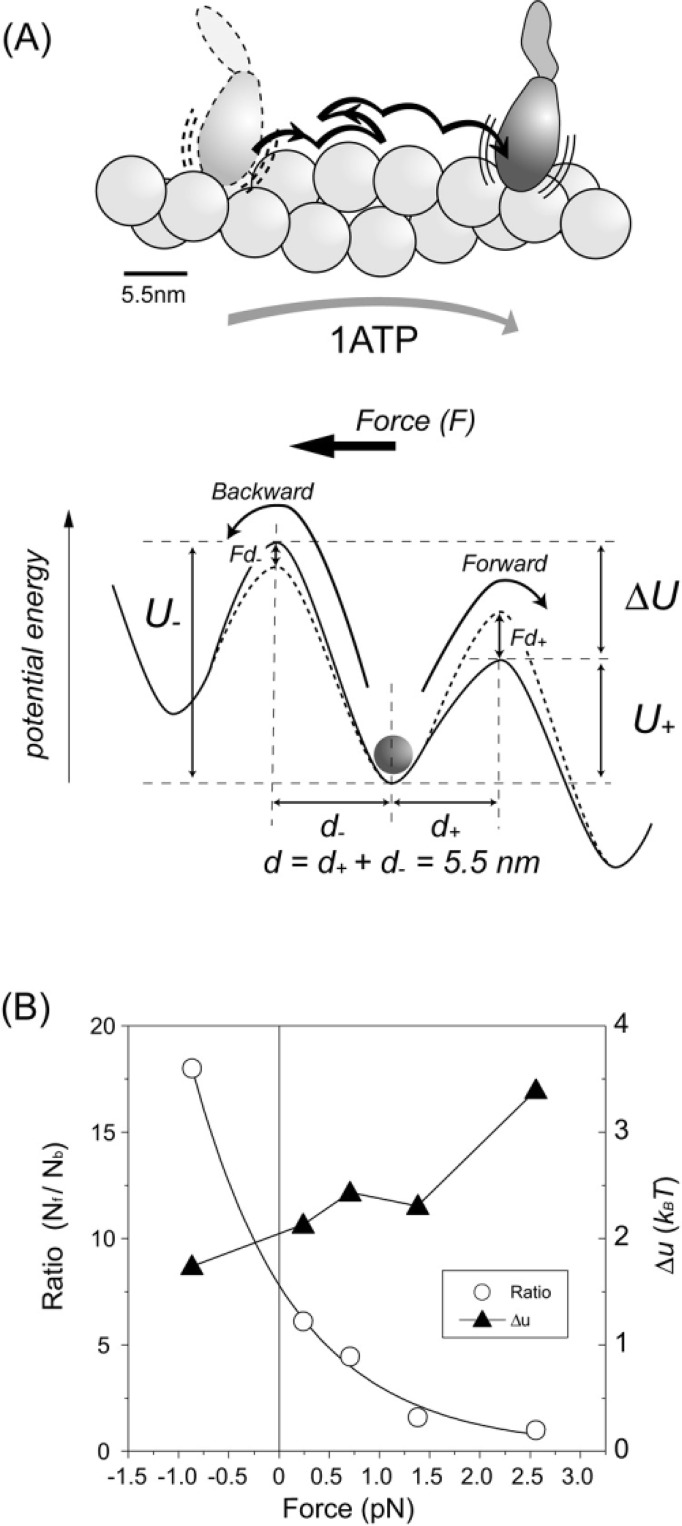
Figure 9.
Potential profile for biased Brownian steps. (A) Biased Brownian steps of a myosin head along an actin filament (Upper) and asymmetric potential of the activation energy (Lower). (B) Ratio of forward and backward steps at various loads (open circles) and difference between the maximum potential barriers for forward and backward steps, Δu (filled triangles) (Supplement Movie 1).

