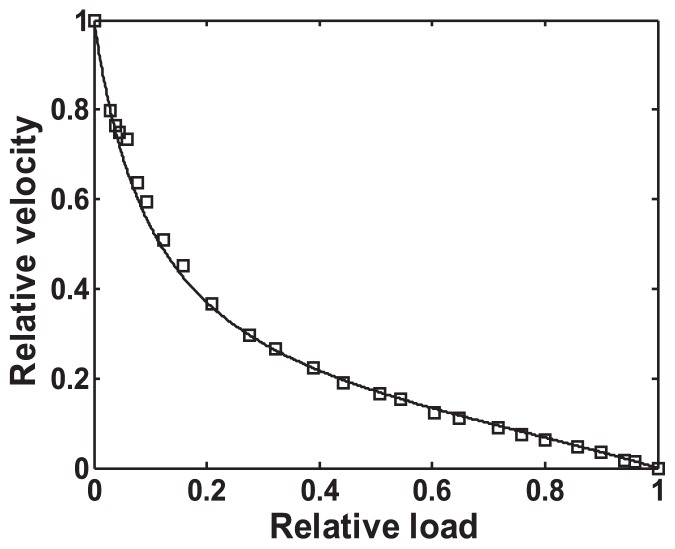
Figure 6.
Load-velocity relationship: Comparison of the theoretical indication and experimental data. Normalized load P/Pmax = θ/θmax vs. normalized velocity V/Vmax is plotted. It is assumed that (1) angle α+β+θ = π/2 at 1/2 Vmax; the myosin head slides along L-axis at V= 1/2 Vmax, and (2) α+β+θmax =π at isometric contraction, and (3) the numerical value of α is obtained by the inclination angle of the right-handed long-pitch strand on the radial projection; that of β is determined by the sliding direction at Vmax on the interaction unit of the radial projection. The results are in good agreement between the theoretical indication (solid line) and the experimental data (square) reported by Edman and Hwang (Fig. 2 of Edman & Hwang, 1977). Here, α and β are (67/180) π and (11/180) π radian, respectively.

