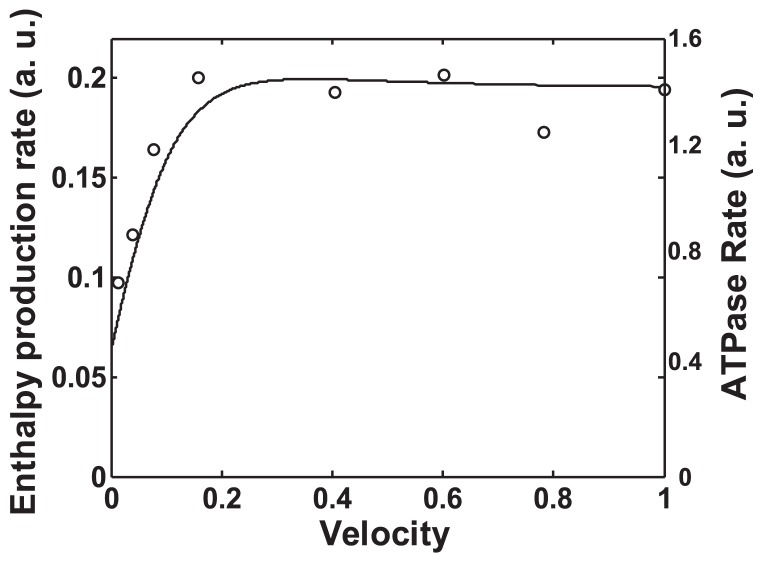
Figure 8.
Actin-activated myosin ATPase rate and the enthalpy production rate of myosin head calculated by the revised Hill’s formulae. Both are plotted against the normalized sliding velocity. The circles show the actin-activated myosin ATPase rate derived by analyzing Harada et al.’s experimental data in the case of double-headed myosin (Fig. 4 of Harada et al. 1987) using ATPase concentration as a parameter. The solid line represents the enthalpy production rate of the myosin head calculated by the revised Hill’s formulae based on the normalized load-velocity relationship shown in Figure 6.

