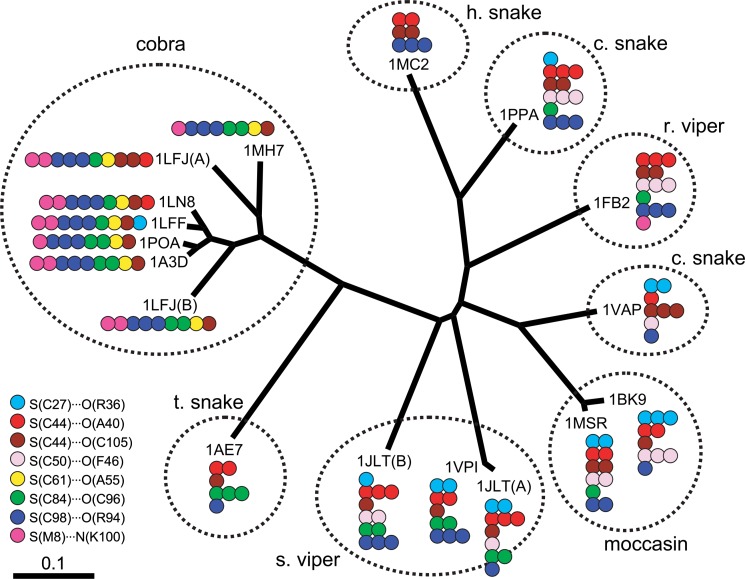
Figure 4.
The dendrogram of snake PLA2 (sPLA2-DG). The eight commonly observed S···X interactions (see Table 2) are mapped on the figure by color circles, the number of which indicates the strength of the corresponding interaction; one circle for 0.1<d≤0.2 Å, two circles for 0.0<d≤0.1 Å, and three circles for d≤0.0 Å. As for Russell’s viper (r. viper), the smallest value of d was used for each interaction to determine the number of circles.

