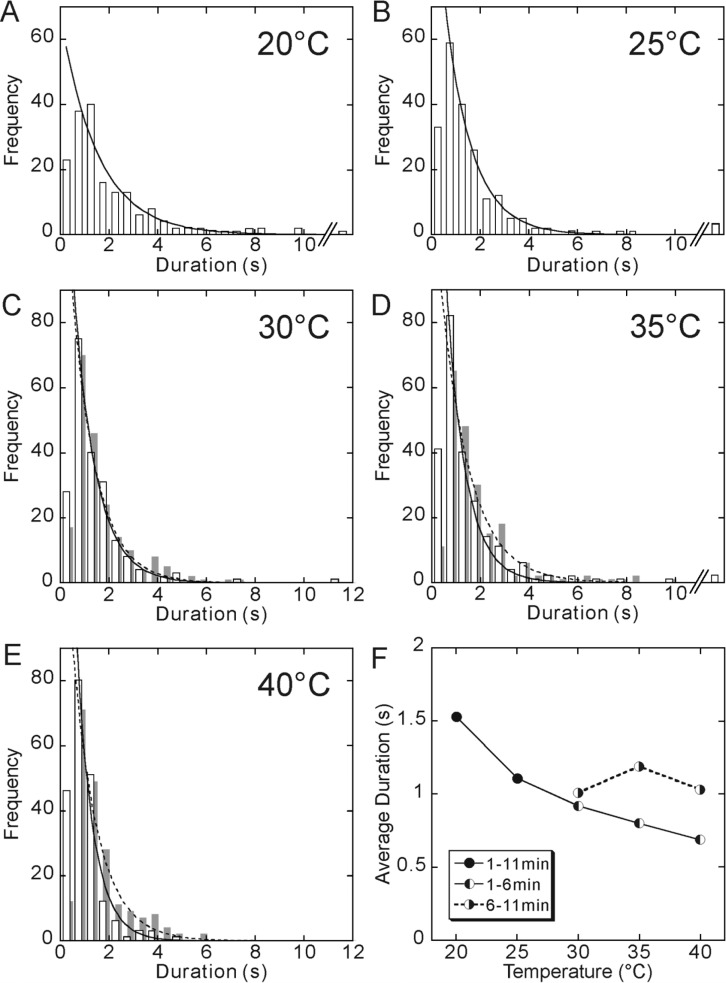
Figure 3.
Temperature dependence of duration. The data at 20°C (A) and 25°C (B) were obtained between 1 and 11 min of incubation at each temperature. On the other hand, for 30°C (C), 35°C (D) and 40°C (E), the data obtained between 1 and 6 min of incubation are shown by open bars, whereas the data obtained between 6 and 11 min of incubation are shown by gray bars, because they showed a different set of values, although the shape of the distribution was the same, i.e., approximated by a single exponential. Every distribution of duration was fitted by an exponential function (a solid or a dashed curve). Only runs longer than 0.5 s were included in the analysis. The average duration, which was defined as the characteristic time of the exponential function, was 1.53, 1.11, 0.92 (1.01), 0.80 (1.19) and 0.69 (1.03) s, at 20, 25, 30, 35 and 40°C, respectively (the values in the parentheses, the data for 6–11 min). In Fig. 3F, these values are shown by closed circles for 20 and 25°C and left-half filled circles for 30, 35 and 40°C connected by a solid line. Right-half filled circles (connected by a dashed line) show the average duration obtained from the data taken between 6 and 11 min of incubation at 30, 35 and 40°C.

