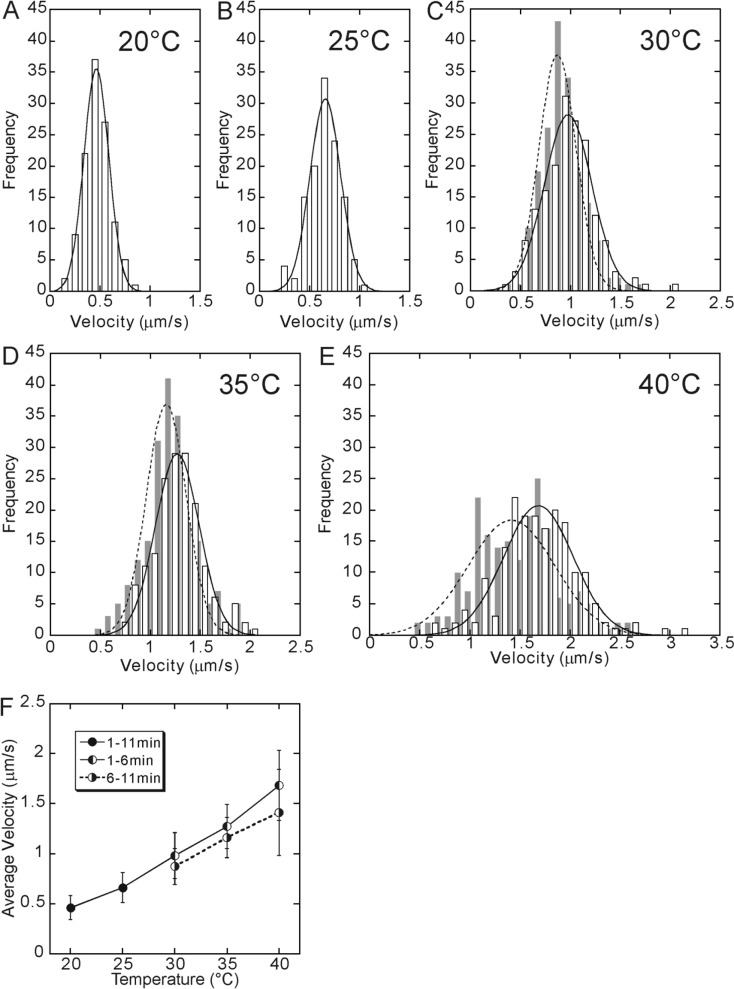
Figure 4.
Temperature dependence of walking velocity. The data at 20°C (A) and 25°C (B) were obtained between 1 and 11 min of incubation at each temperature. On the other hand, for 30°C (C), 35°C (D) and 40°C (E), the data obtained between 1 and 6 min of incubation are shown by open bars, whereas the data obtained between 6 and 11 min after the incubation are shown by gray bars, because they showed a different set of values although the shape of the distribution was the same, i.e., approximated by a single Gaussian. The average walking velocity, which was defined as a peak of the Gaussian distribution, was 0.46, 0.66, 0.98 (0.87), 1.27 (1.16) and 1.68 (1.41) μm/s at 20, 25, 30, 35 and 40°C, respectively (the values in the parentheses, the data for 6–11 min). In Fig. 4F, these values are shown by closed circles for 20 and 25°C and left-half filled circles for 30, 35 and 40°C connected by a solid line. Right-half filled circles (connected by a dashed line) show the average velocity obtained from the data taken between 6 and 11 min of incubation at 30, 35 and 40°C.

