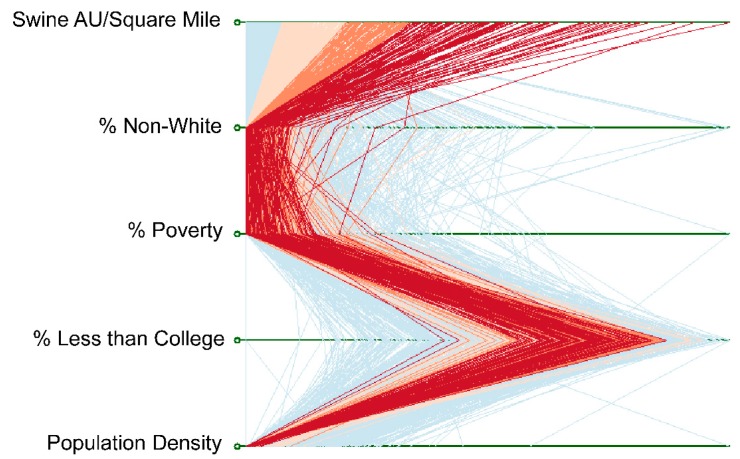
Figure 7.
Parallel coordinate plot showing the relationship between Census block group observations of swine AU density and traditional EJ variables, as well as population density. Each line is a CBG. Red and orange lines highlight the characteristics of CBGs with the highest standard deviations of swine densities.

