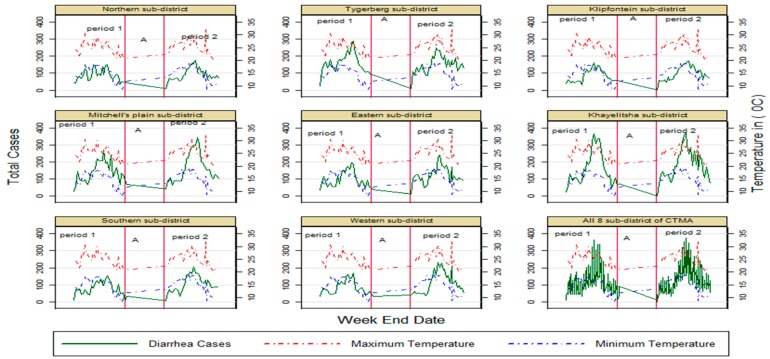
Figure 1.
Trend in diarrhoea cases with change in min and max temperature in Cape Town Metropolitan Area CTMA sub-districts and in all eight sub-disricts. Period 1: November2012–May 2013; period 2: November 2013–May 2014, (A): period between period 1 and period 2 when no data were present for analysis (June 2013–October 2013).

