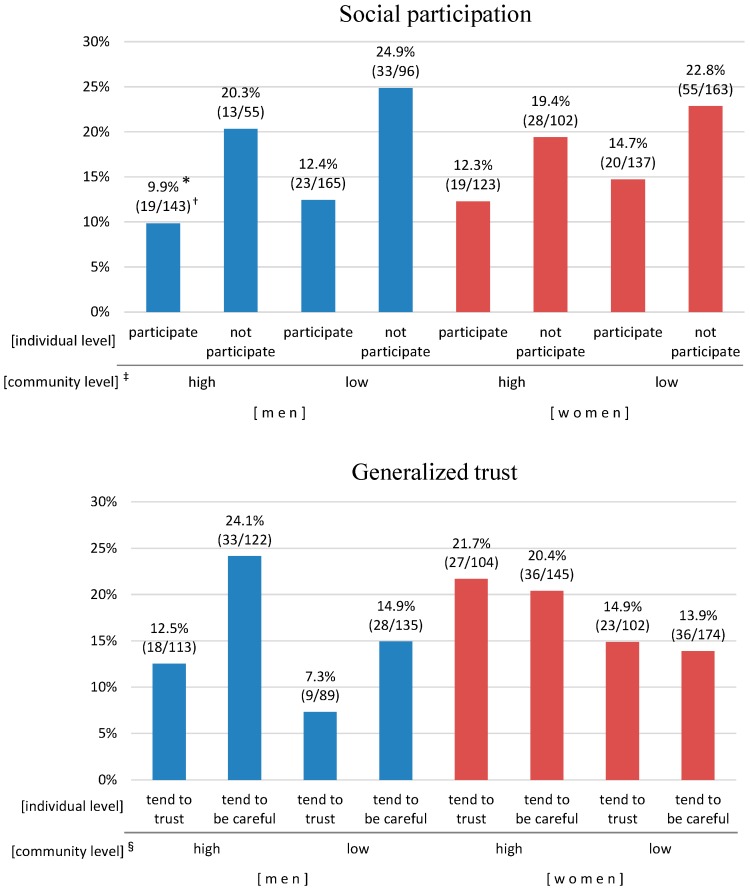
Figure 2.
Relationship of community level and individual level social capital to composite outcome by gender. * Adjusted probability from the fixed effects only of composite outcome for each category by gender stratified multilevel logistic analyses after adjusting for all covariates; † Number of outcomes/analyzed population; ‡ High: area B, C, D, E. Low: area A, F, G, H; § High: area C, D, F, H. Low: area A, B, E, G.

