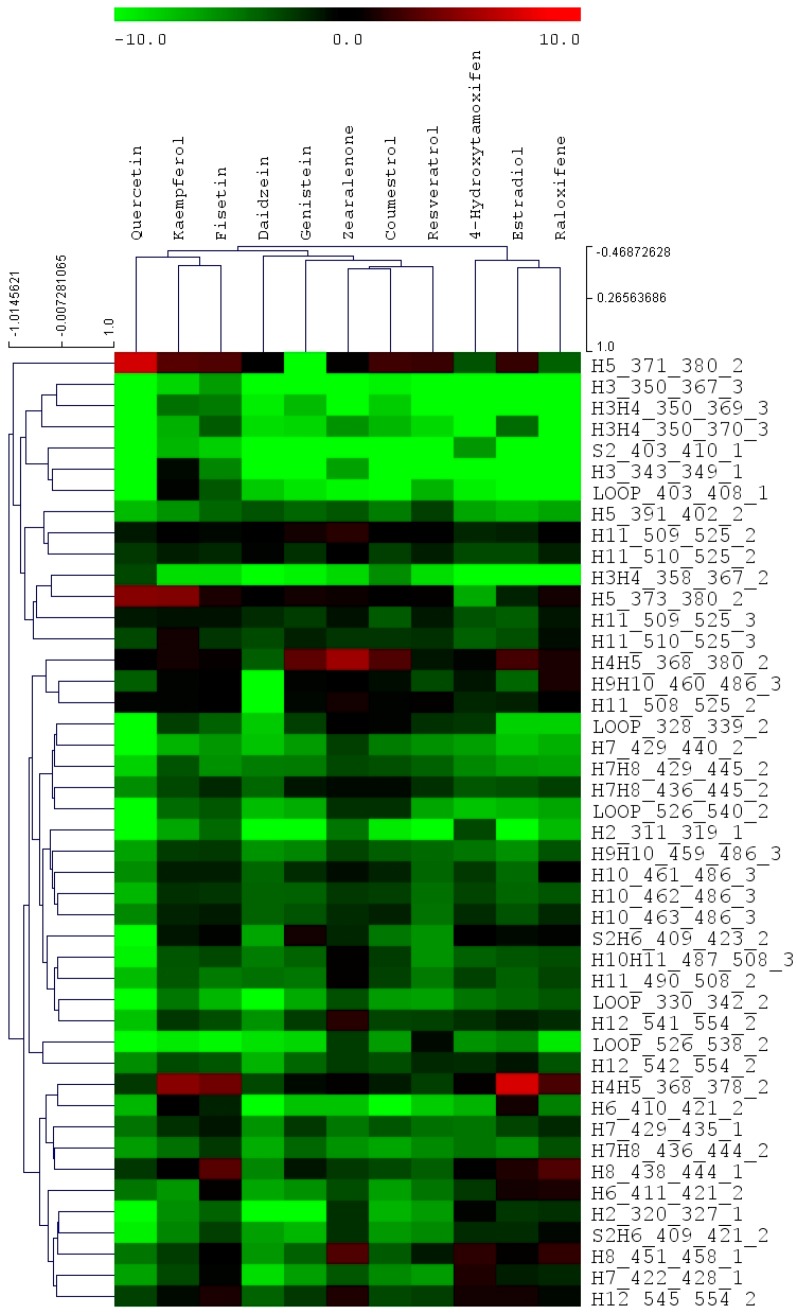
Figure 2.
Cluster analysis of all analyzed compounds. The names of compound are shown above the bar view, and the peptide regions are shown on the right of the bar view. The color represents the differential deuterium level of each peptide in the absence and presence of compounds. The scale is presented in percentage (%).

