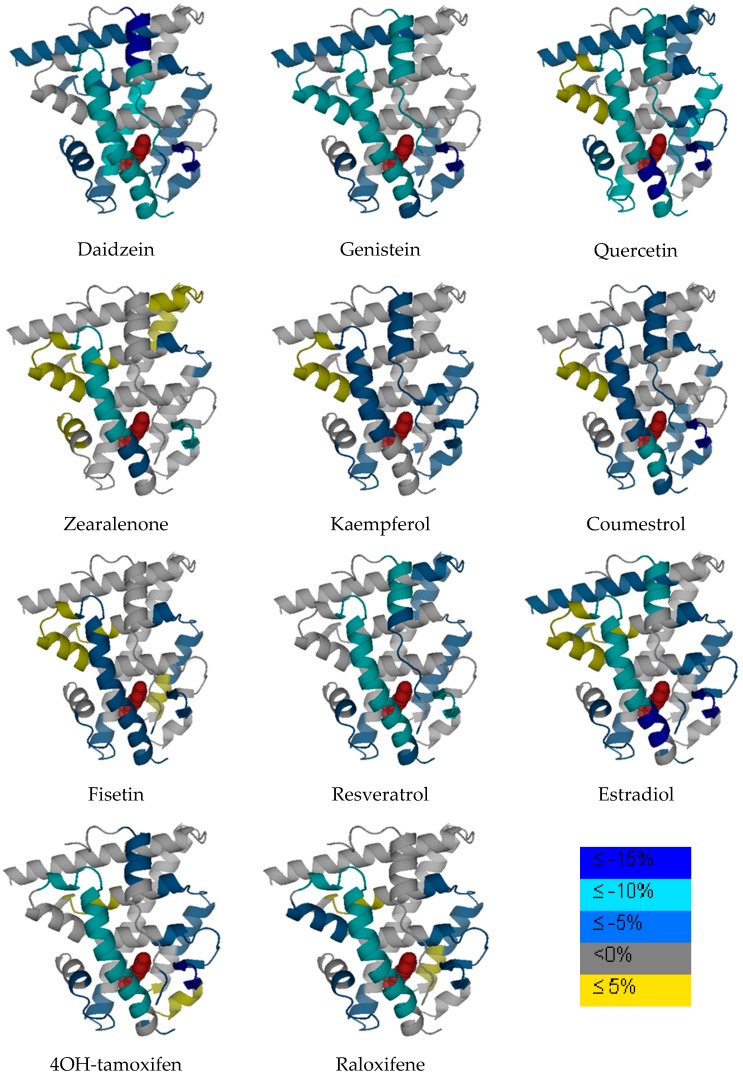
Figure 3.
ERαLBD-ligand HDX profiles overlaid onto the ER crystal structure of estradiol (PDB ID: 1ERE). The color legend shows the deuterium incorporation difference by subtracting deuterium incorporation content of holo ERαLBD from apo ERαLBD. The compound showing in the protein ligand complex is estradiol for presentation purpose, but not representing the other compounds analyzed in this study.

