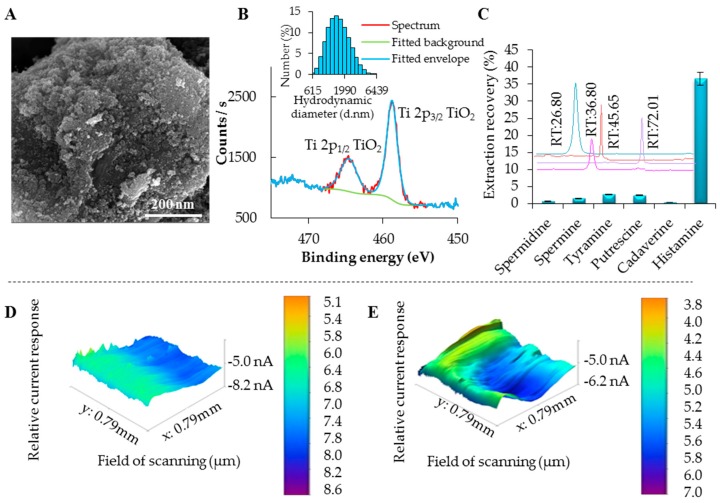
Figure 3.
Basic characterization of prepared PMPs. (A) Micrograph, expressing microparticles surface and morphology, the length of scale bar is 200 nm; (B) XPS narrow scan of Ti2p of MAN18; (C) Binding specificity of the prepared particles after application of 100 µg·mL−1 of selected Bas. Chromatograms showing various retention times of BAs immobilized on PMPs, with expression of their peak area representing the amount specifically bound on PMPs. Scanning electrochemical microscopy 3D images characterizing the PMP electrochemical surface changes after binding of Him, relative current response of PMP surface: (D) for blank PMPs without Him bound to their surface and (E) for PMPs after binding of Him.

