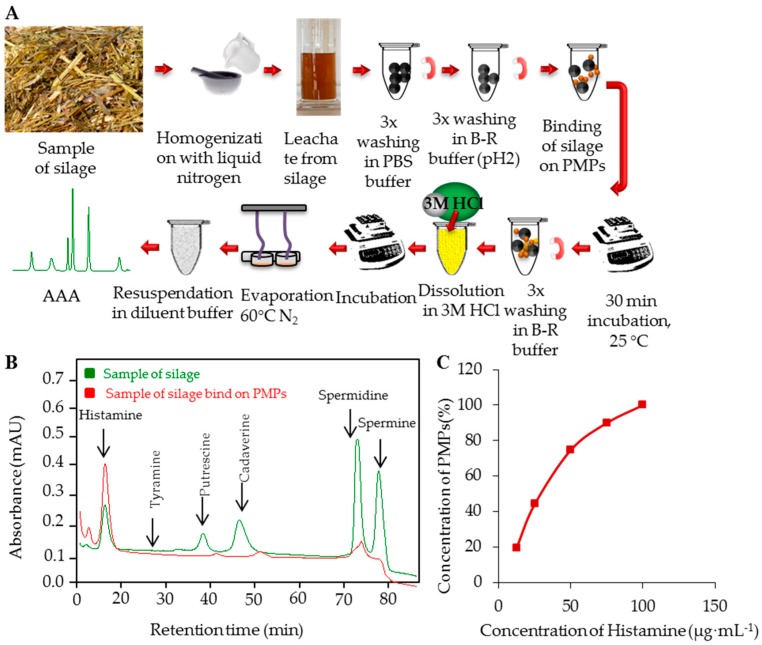
Figure 4.
(A) Scheme of isolation of biogenic amines from silage sample of PMPs; (B) Typical chromatograms overlay: red—Samples of silage bound on PMPs and green—Sample of silage before isolation on PMPs; (C) Saturation curve measured under the optimal conditions within tested concentration range 2, 4, 8, 12, and 16 mg·mL−1 of PMPs.

