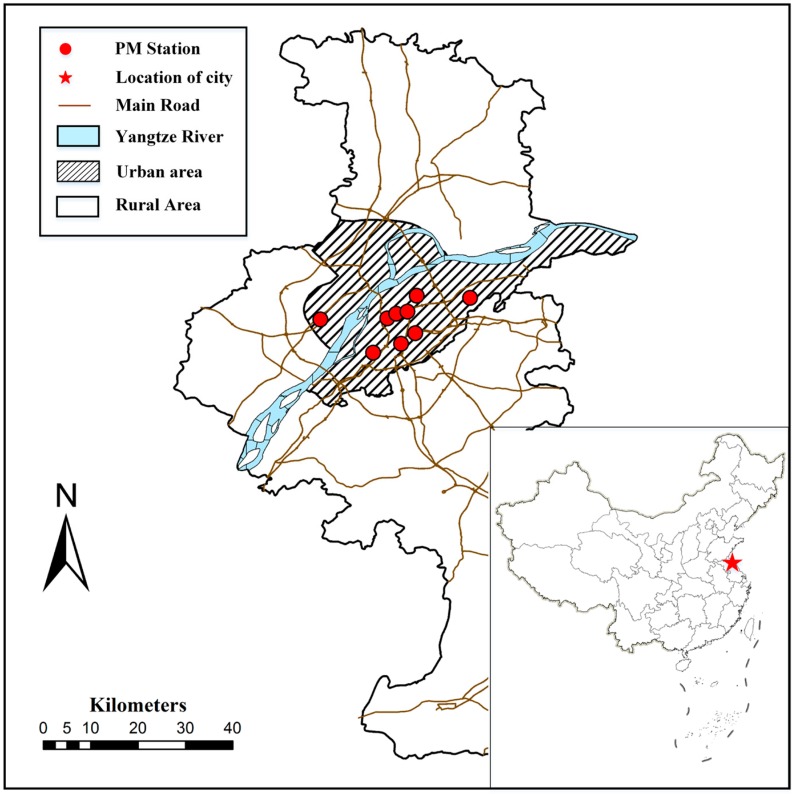
Figure 1.
Map depicting the location of Nanjing in China (red star), air quality stations (red circles) and the distribution of main roads, urban areas, and rural areas. The corresponding PM2.5 monitoring sites are: Pukou, Caochangmen, Shanxilu, Xuanwuhu, Maigaoqiao, Xianlindaxuecheng, Aotizhongxin, Zhonghuamen, and Ruijinlu (from left to right: six above and three below).

