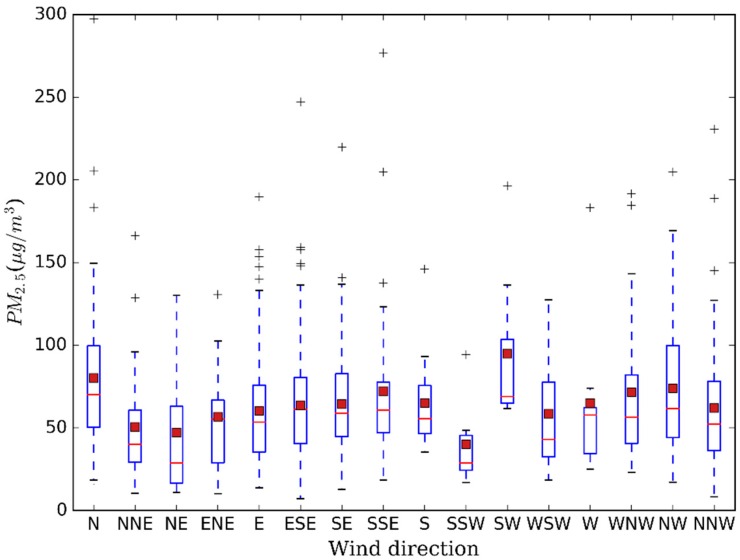
Figure 10.
Box-Whiskers plot of PM2.5 mass concentration related with wind direction. Bottom and top of the blue box represent 25th and 75th percentile, whereas bottom and top of the vertical dotted line mean minimum and maximum value. The red solid lines represent median value and the firebrick square represent mean value. Outliers are depicted by the “+”.

