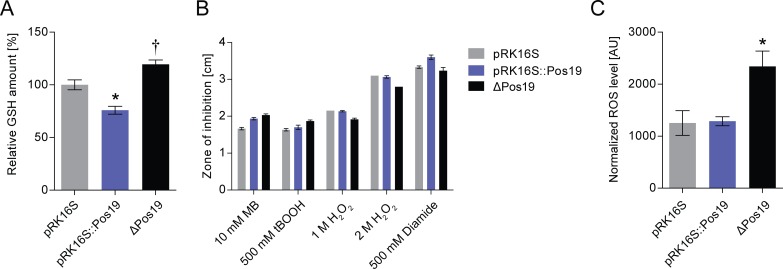
Fig 4. Pos19 influences GSH and ROS levels.
(A) Measurement of total intracellular glutathione (GSH). GSH was measured using Ellmann’s reagent (DTNB) in cell samples from three R. sphaeroides strains: an empty vector control (pRK16S), a strain with a constitutive, plasmid-borne over-expression of Pos19 under the control of the 16S rRNA promoter (pRK16S::Pos19), and the Pos19 mutant (ΔPos19). The relative GSH amount is depicted in percent; the GSH amount of the empty vector control (pRK16S) was set to 100 percent. All results represent the mean of nine independent biological experiments with technical duplicates. Error bars reflect the standard error of mean. The level of significance compared to the control (pRK16S) is indicated († 0.05 < p < 0.1 and * p < 0.05). (B) Inhibition zone assay using 10 mM methylene blue (MB) in the light, 500 mM tBOOH, 1 M and 2 M hydrogen peroxide (H2O2), and 500 mM diamide. The diameter of the zones of inhibition was measured for the three R. sphaeroides strains described above for the GSH assay. The data represent the mean of three independent experiments with technical duplicates. The error bars represent the standard error of mean. (C) Effect of Pos19 on ROS levels. Determination of intracellular levels of ROS in the control strain (pRK16S) compared to Pos19 over-expression (pRK16S::Pos19) and mutant (ΔPos19). ROS generated by the cells were analyzed after reaction with 10 μM 2,7-dihydrodichlorofluorescein diacetate. The fluorescence intensity was normalized to the optical densities of the samples. The resulting values are presented in arbitrary units (AU). The data represent the mean of three independent experiments. The error bars indicate the standard error of mean. The level of significance compared to the control (pRK16S) is indicated (* p < 0.05).

