
Fig 3. MDS representation of the distances among 264 strains of X. arboricola pv. pruni.
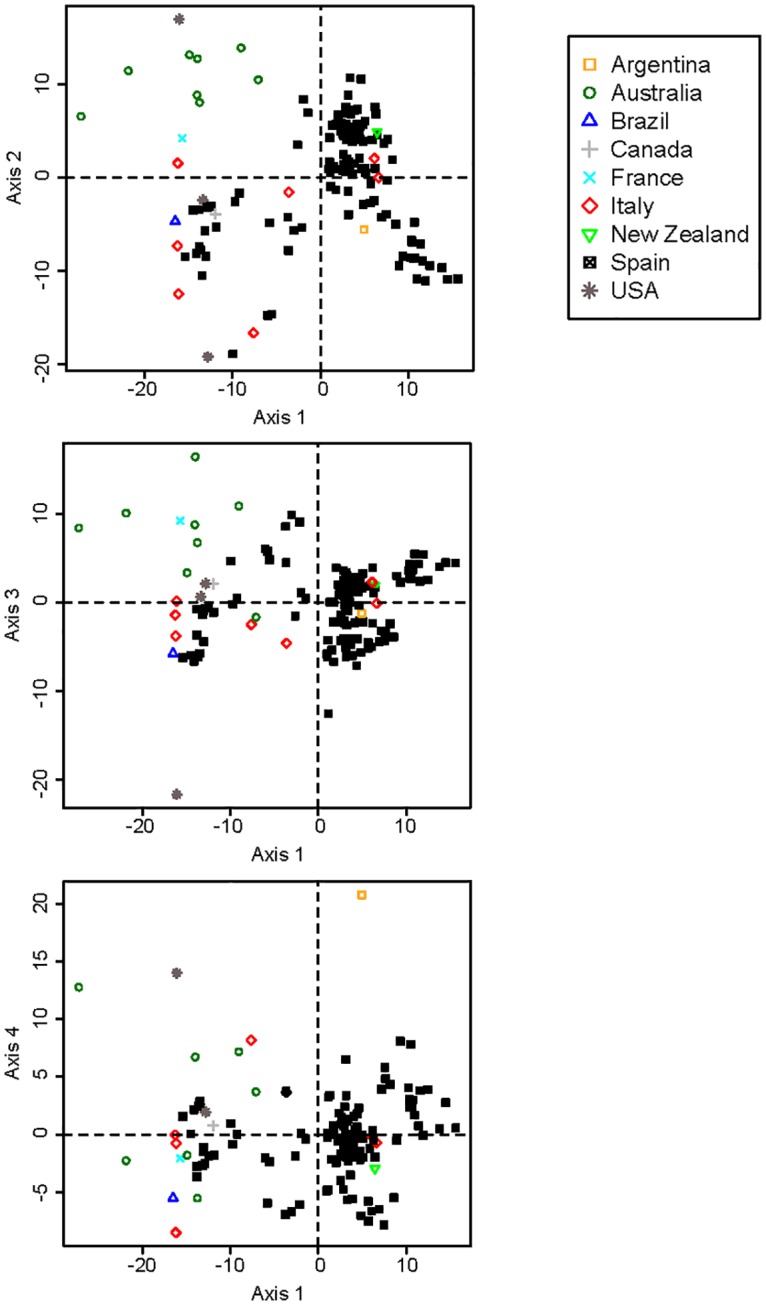
Countries of origin are represented by different symbols. MDS axes 1–2, 1–3 and 1–4 described 59.3%, 47.4% and 44.4% of the total variation, respectively.
Official websites use .gov
A
.gov website belongs to an official
government organization in the United States.
Secure .gov websites use HTTPS
A lock (
) or https:// means you've safely
connected to the .gov website. Share sensitive
information only on official, secure websites.
Countries of origin are represented by different symbols. MDS axes 1–2, 1–3 and 1–4 described 59.3%, 47.4% and 44.4% of the total variation, respectively.