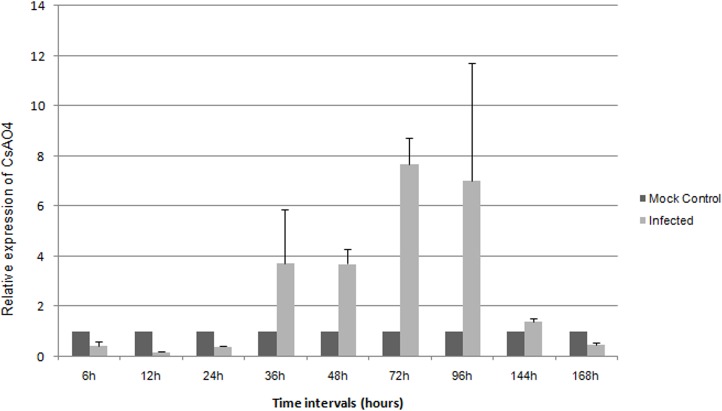
Fig 5. Relative AO expression levels in C. sativus cv. Summer Green at different time points during CMV infection.
Buffer inoculated plants served as control samples for each time interval. Relative expression levels were determined at various time points (6, 12, 24, 36, 48, 72, 96, 144 and 168 h) in comparison to mock inoculated plants at the same time points. The cucumber Actin gene was used to normalize all data and error bars illustrated the standard deviation about the mean for three independent biological replicates. Relative expression was plotted as 2-ΔΔCT (fold change) values. h- hours post inoculation.

