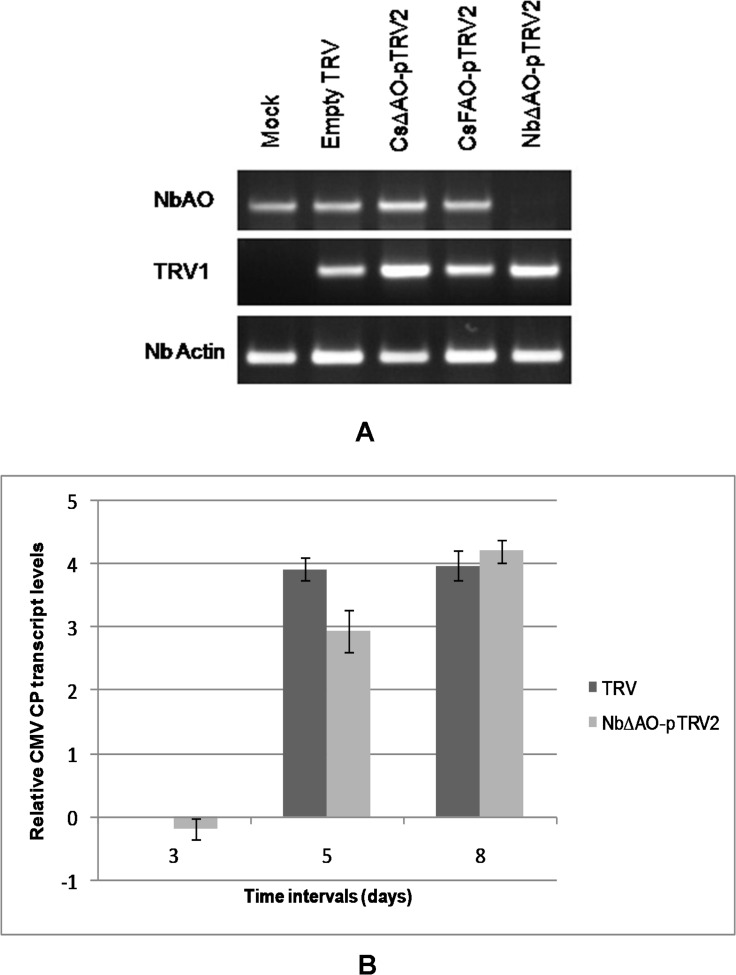
Fig 8. Quantification of NbAO and CMV CP RNA levels in silenced plants.
A) Transcript levels of NbAO were assessed by semi-quantitative RT-PCR using complete gene primers. NbActin was used as an internal control and TRV infection was checked by detecting the presence of TRV RNA1. B) Relative CMV CP RNA accumulation in TRV control and NbΔAO-pTRV2 silenced plants. CP RNA accumulation in AO silenced plants was calculated relative to CMV-infected TRV control plants at 3 dpi. The 18SrRNA gene was used to normalize all data and error bars represent the standard deviation about the mean for three independent biological replicates. Relative expression was plotted as Log2 values.

