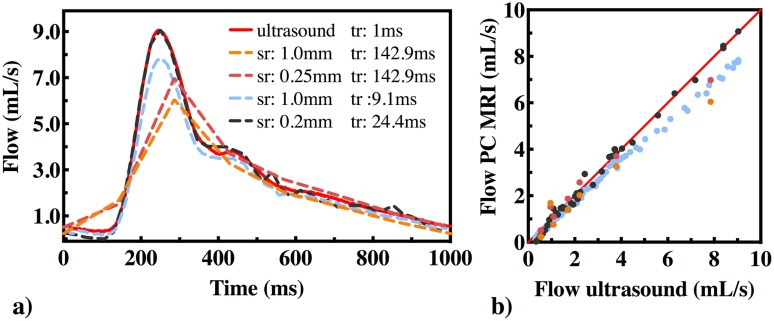
Fig 2.
a) Flow waveforms at different spatial(sr) and temporal(tr) resolutions. Dashed lines show the PC-MRI measurements and the red line shows the ultrasound probe measurement. Spatial resolution varied between 0.2mm and 1 mm and the temporal resolution varied between 9.1 ms and 142.9 ms. b) Ultrasound probe vs. PC-MRI flow measurements.

