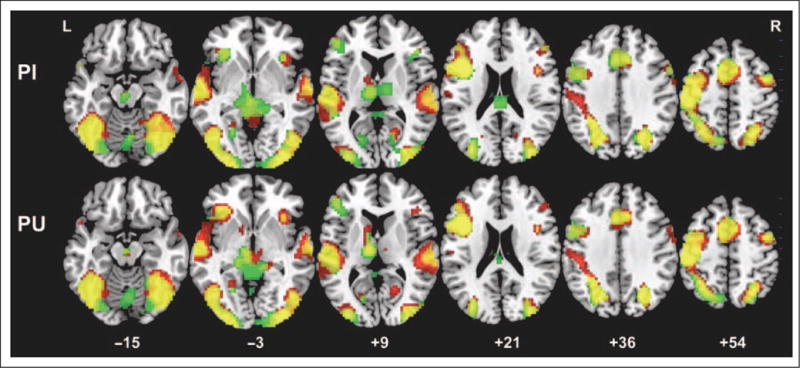
Figure 4.

Brain activation maps for both trained PI and PU characters in the early and late scan sessions. Green indicates activation for the early scan; red indicates activation for the late scan; yellow indicates overlapping activation for both scan sessions. p < .05, FDR corrected, greater than 10 voxels.
