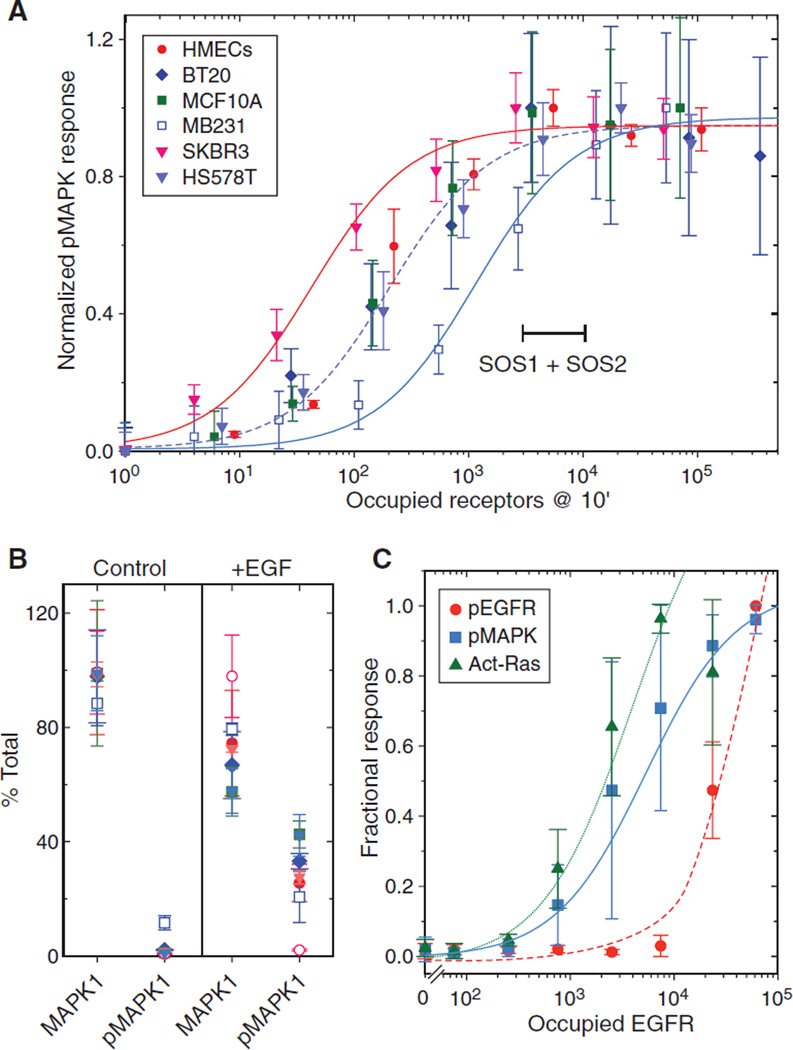
Fig. 6. Maximal phosphorylation of MAPK in a panel of responsive cell lines occurs well below maximal receptor occupancy.
(A) Plot of the amounts of occupied EGFR and activated (phosphorylated, “p”) MAPK in the indicated cell lines. Data are the mean response of n = 5 independent experiments normalized to a scale of 0 to 1 ± SEM as a function of occupied receptors at 10 min. Sigmoidal curves were fit to data from SKBR3 (red), HS578T (dashed), and MDA-MB231 (blue) cell lines. Range marker corresponds to the abundance range of SOS1 + SOS2 in evaluated cell lines. Results from MCF7 cells were not included because of their lack of significant response. (B) Abundance of MAPK1 or doubly phosphorylated MAPK1 in cells treated with and without EGF (10 ng/ml) for 10 min assayed by quantitative SRM-based proteomics (55). Results are from n = 3 samples with technical replicates expressed as percent of total MAPK1 ± SD. Open circles are from MCF7 cells, whereas other symbols are the same as in (A). (C) HMEC 184A1 treated with EGF (10 ng/ml) for 5 min and occupied EGFR calculated as described in Materials and Methods. The amounts of phosphorylated MAPK (blue squares) and phosphorylated EGFR (red circles) were measured using an enzyme-linked immunosorbent assay; RAS activity was measured by a pull-down assay (42). Data are the mean response of n = 4 independent experiments normalized to a scale of 0 to 1 ± SEM and fit to a sigmoid function.

