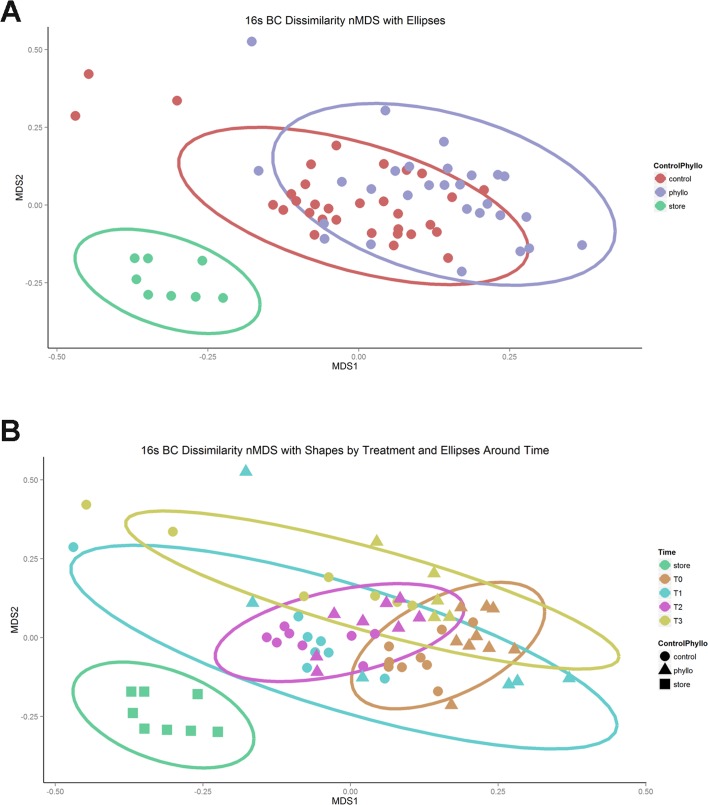
Fig 3. NDMS of 16S Communities from Store, Control and Phyllosphere Environments at 4 time-points.
3a Bray-Curtis ordination colored by environment (control (plastic), phyllosphere, and store bacterial communities). A very clear separation of store microbiota (green) is evident, however no significant separation between communities associated with control (red) and phyllosphere (purple) is evident. 3b Bray Curtis ordination colored by time-point. Time-point 0 (T0) and Time-point 1 (T1) appear to separate from each other and also from time-points 2 (T2) and 3 (T3), however T2 and T3 are more similar. For both 1a and 1b, the ellipse defines the upper 95th percentile limit of the assumed distribution.

