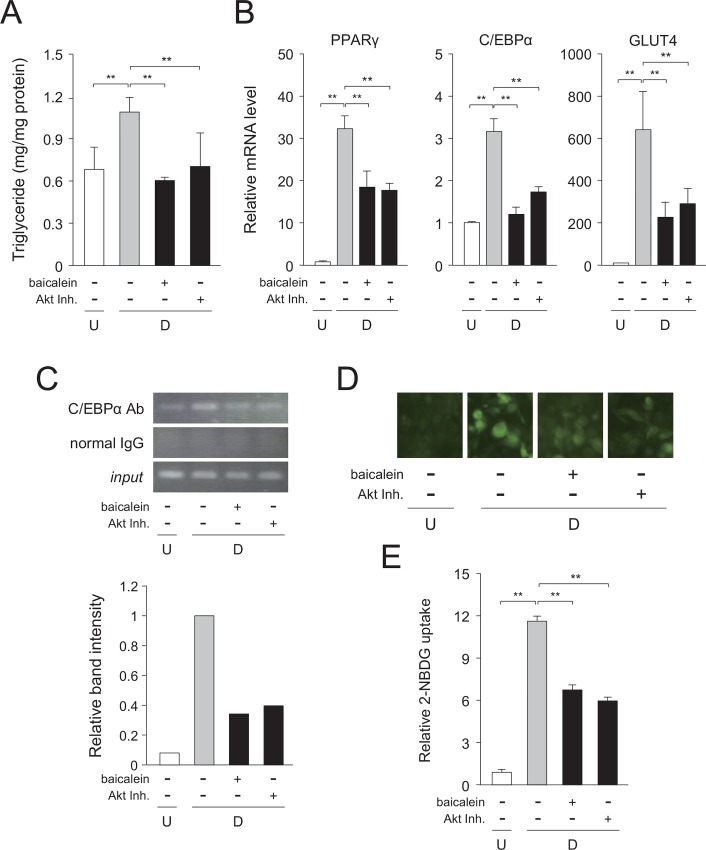
Fig 8. Inhibition of very early stage of adipogenesis in 3T3-L1 cells by baicalein or Akt inhibitor.
A, Intracellular triglyceride level. 3T3-L1 cells (undifferentiated cells: U; white column) were differentiated into adipocytes (differentiated cells: D; gray column) for 6 days and treated with baicalein or an Akt inhibitor (Akt Inh.; black columns) for the initial 1.5 h of adipogenesis. Data are presented as the means ± S.D. from three experiments. **p<0.01, as indicated by the brackets. B, Expression levels of adipogenic genes. Cells were cultured as described in the legend of Fig 8A. Data are shown as the means ± S.D. from three experiments. **p<0.01, as indicated by the brackets. C, ChIP assay. 3T3-L1 cells were cultured as described in the legend of Fig 8A. The results are representative from three experiments. Band intensity was measured with MultiGauge software. D, Change in glucose uptake. 3T3-L1 cells were cultured as described in the legend of Fig 8A. Cells were then incubated with fluorescent 2-NBDG, and then observed under a fluorescence microscope. The results are representative from three experiments. E, Quantification of glucose uptake in baicalein- or Akt inhibitor (Akt Inh.)-treated 3T3-L1 cells. The data are presented as the value relative to that of the undifferentiated cells and are shown as the means ± S.D. from three experiments **p<0.01, as indicated by the brackets.

