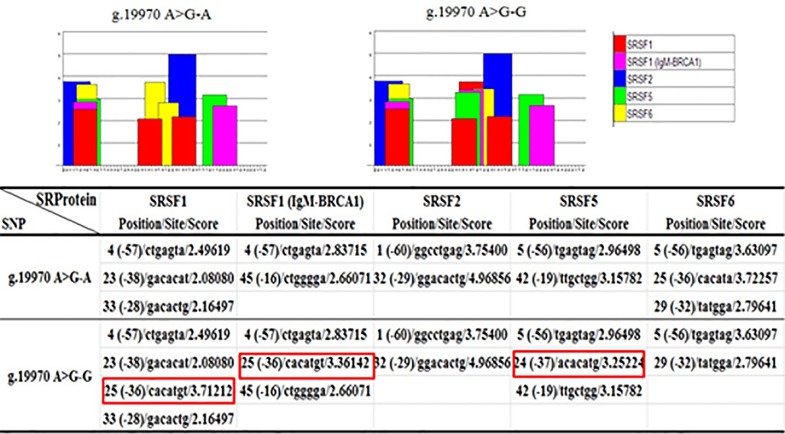
Fig 3. Exonic splice enhancer (ESE) motif threshold scores associated with INCENP genotypes.
Bar graphs represent scores above the threshold for the ESE motifs within the A or G allele in locus g.19970 A>G. The red square indicates that the introduction of allele G, relative to allele A in locus g.19970 A>G, increased three binding sites of the auxiliary splicing proteins SRSF1, SRSF1 (IgM-BRCA1) and SRSF5 and deleted one of SRSF6.

