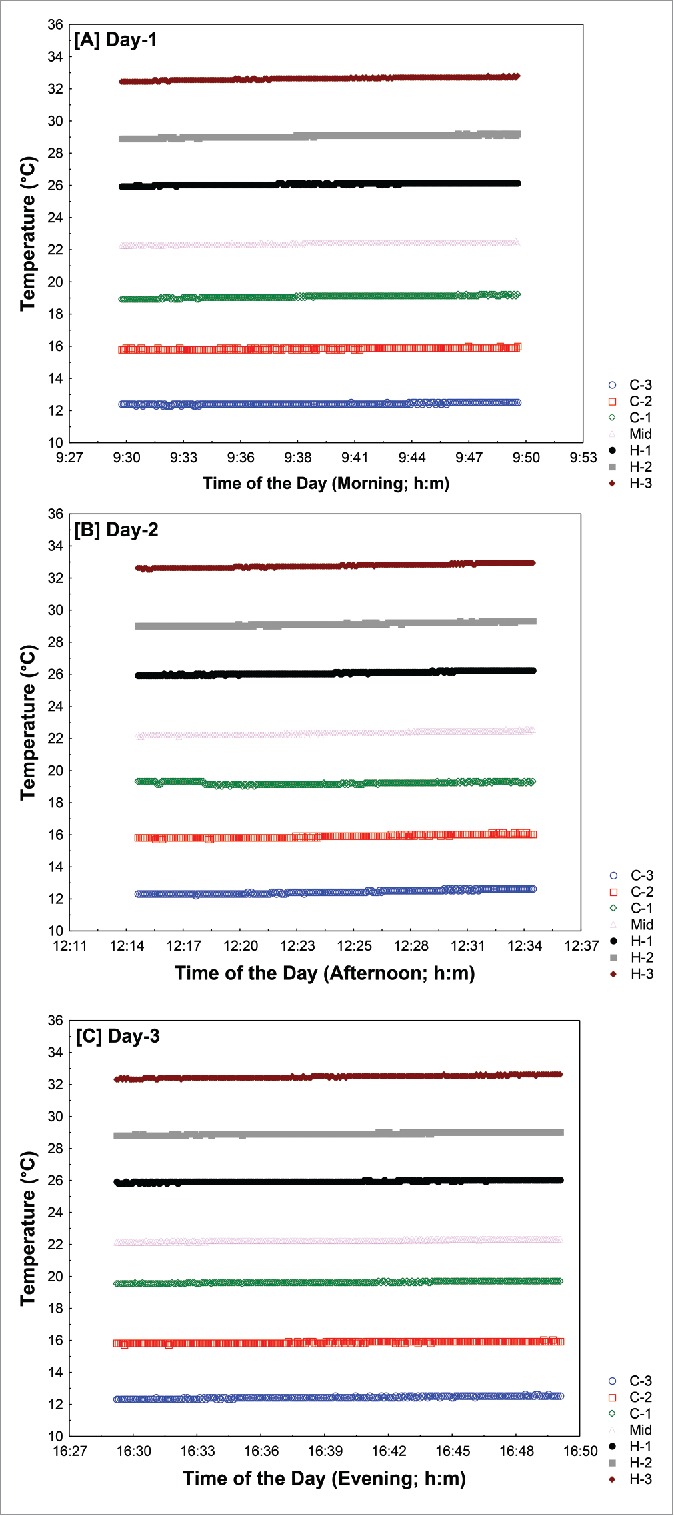
Figure 3.

Measure of temperature repeatability along the thermal gradient. Temperature probe locations are indicated as C3, C2, C1, Mid, H1, H2, H3 (ordered from lower to higher temperature; see Fig. 2 also). Temperature along the thermal gradient was collected for 3 different days in the morning (A), in the afternoon (B) and in the evening (C). Different colors correspond to different probes.
