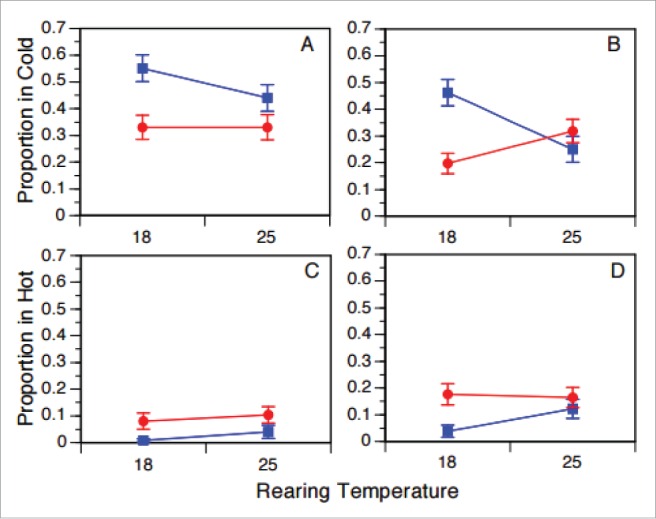
Figure 7.

The plots depict the proportion of flies in the cold habitat (panels A, B) and the hot habitat (C, D) of the thermal gradient when reared under culture temperatures of 18°C and 25°C. Females are shown in panels A and C, males in panels B and D. The blue lines/rectangles depict the temperate (ME) populations and the red lines/circles denote the subtropical (FL) populations. Plotted are means.
