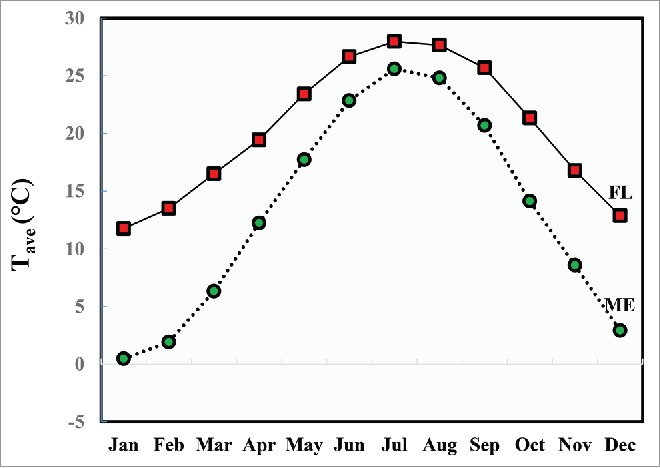
Figure 8.

Twelve-month average temperature patterns for the sites of origin for the assayed populations. Jacksonville (30.33 N), and Bowdoin (44.03 N) station Tave is shown in solid (with rectangles), and dotted (with circles) lines respectively. Projections displayed here are the averages of 30 years (1980–2010). Climatic data was obtained from National Oceanic & Atmospheric Administration (NOAA; www.ncdc.noaa.gov).
