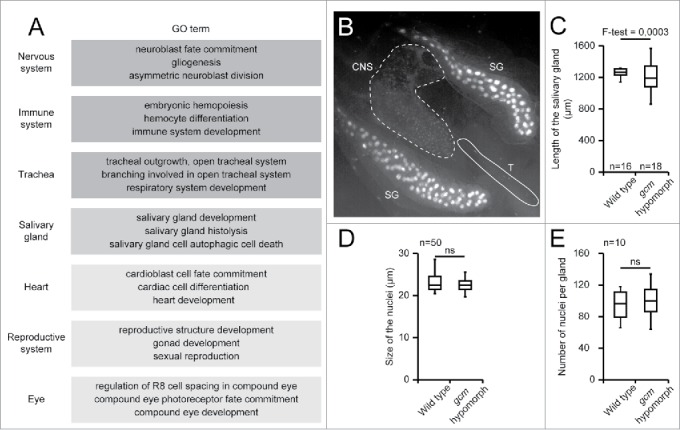
Figure 2.

A) Tissues associated GO terms issued from the enrichment analysis carried out on the list of genes identified as Gcm direct target by the DamID screen, using DAVID.30,69,70 The list displayed was arbitrarily limited to 3 GO terms per tissue, each GO term being enriched more than 2 folds with a P-value below 0.05. Dark gray indicates tissues/biological processes already known to require Gcm, intermediate intensity gray indicates a tissue analyzed in this report, pale gray indicates tissues/biological processes still not shown to require Gcm. B) Gcm lineage analysis revealed by GFP labeling in a gcmGal4/+;gtrace/+ 3rd instar larva. Tissues were analyzed by epifluorescence microscopy (20x). Note the presence of GFP positive cells throughout the salivary glands (SG), in the central nervous system (CNS) and in the trachea (T). The signal is much stronger in salivary glands, due to chromosome polytenysation. C) Length of the salivary glands in wild type and in gcm hypomorphic 3rd instar larvae (n = number of salivary glands). F-test was used to compare the variance in the 2 genotypes. The gcm hypomorphic allele used is gcmGal4 (also called P{GawB}gcmrA87.P, Flybase ID: FBti0130081) in homozygous condition. D) Size of the nuclei (diameter) of the salivary gland cells in wild type and in gcm hypomorphic 3rd instar larvae. Size was estimated on 50 nuclei from 5 salivary glands using FIJI. 72 Student test was used to calculate the P-value. E) Number of nuclei in the salivary glands (n = 10) of wild type and gcm hypomorphic 3rd instar larvae. ns indicates that the difference is not significant.
