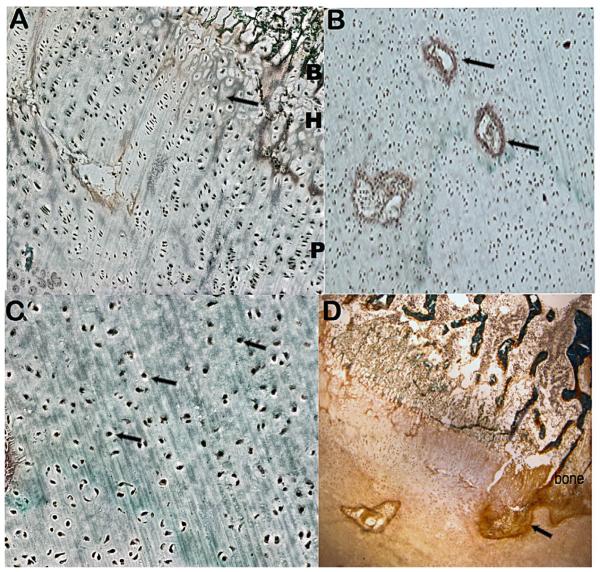
FIG. 2.
ISDR case R02-170 cartilage growth plate histology. (A) Cartilage growth plate (10X) showing poor hypertrophic column formation (arrow) with fibrous septae between the columns; B, bone, H, hypertrophic zone, P, proliferative zone. (B) Proliferative zone (10X) showing increased vascularity (arrows), decreased extracellular matrix and hypercellularity. (C) Reserve chondrocytes (40X) with arrows identifying chondrocytes with central round nuclei. (D) Cartilage stained with Goldner’s reagent showing a fibrous band at the distal end of the growth plate (arrow) and thickened trabeculae in the primary zone of ossification.

