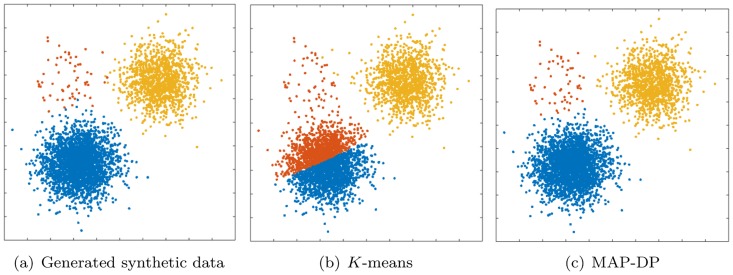
Fig 4. Clustering performed by K-means and MAP-DP for spherical, synthetic Gaussian data.
Cluster radii are equal and clusters are well-separated, but the data is unequally distributed across clusters: 69% of the data is in the blue cluster, 29% in the yellow, 2% is orange. K-means fails to find a meaningful solution, because, unlike MAP-DP, it cannot adapt to different cluster densities, even when the clusters are spherical, have equal radii and are well-separated.

