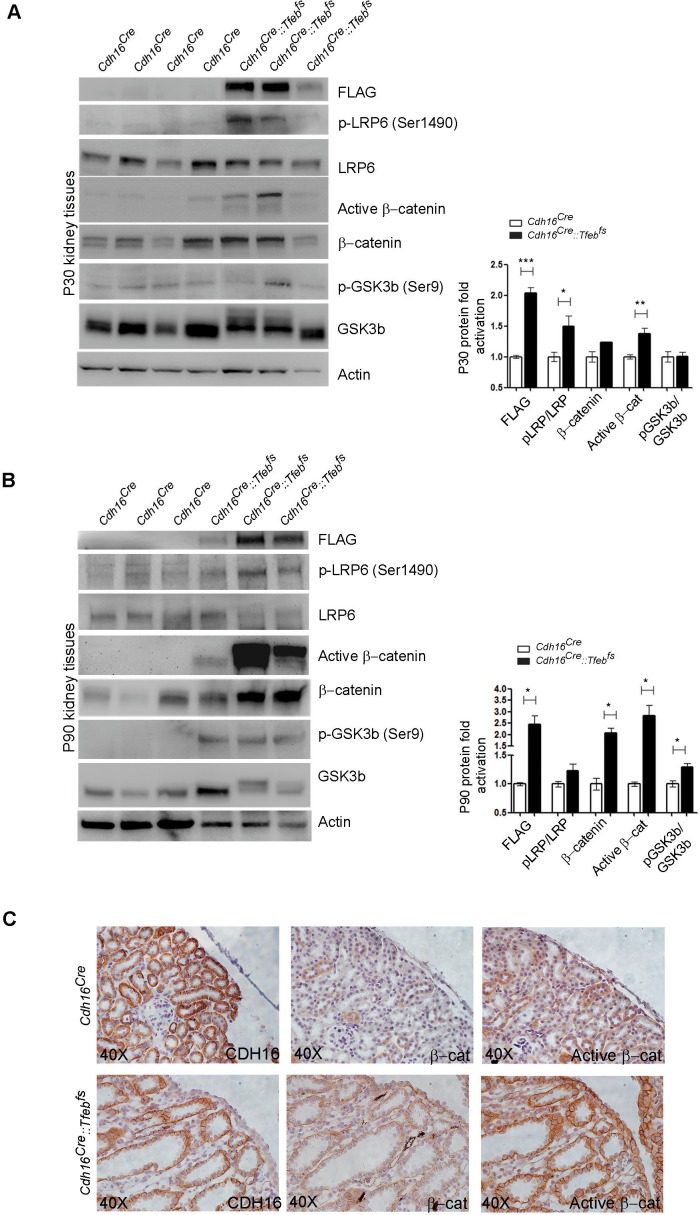
Figure 4. Molecular and histological analysis of WNT signaling.
(A,B) Western blot analysis performed on (A) P30 and (B) P90 kidneys from Cdh16Cre::Tfebfs mice to assess WNT signaling activation by looking at different proteins related to this pathway. Each replicate is a distinct biological sample. p-LRP6 (Ser1490)/LRP6, active β-catenin, β-catenin and p-GSK3β (Ser9)/GSK3β protein levels were quantified by densitometry analysis of the Western blot bands. Values are normalized to actin when not specified, and are shown as an average (± SEM) (*p<0.05, **p<0.01, ***p<0.001, two-sided Student’s t test). (C) Immunohistochemistry staining of CDH16, β-catenin and active β-catenin proteins performed on P30 kidney tissues from Cdh16Cre::Tfebfs mice.


