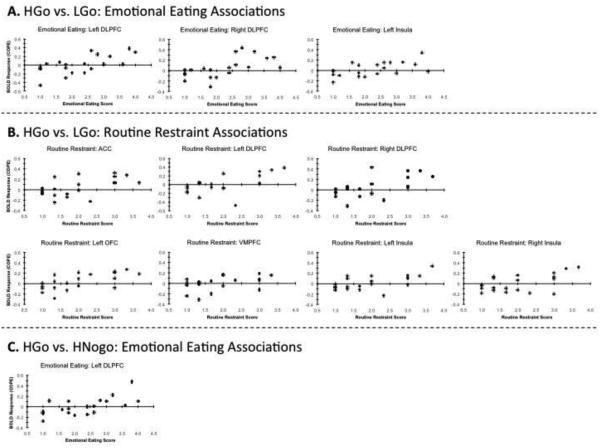
Figure 3.
The associations between the BOLD response (quantified as a contrast of parameter estimates; COPE) and the WREQ subscales. Only the associations that were significant after applying a false discovery rate of q < 0.05 are shown. The top (A) shows the associations between emotional eating and the BOLD response for the HGo vs. LGo contrast. The middle (B) shows the associations between routine restraint and the BOLD response for the HGo vs. LGo contrast. The bottom (C) shows the associations between emotional eating and the BOLD response for the HGo vs. HNogo contrast.

