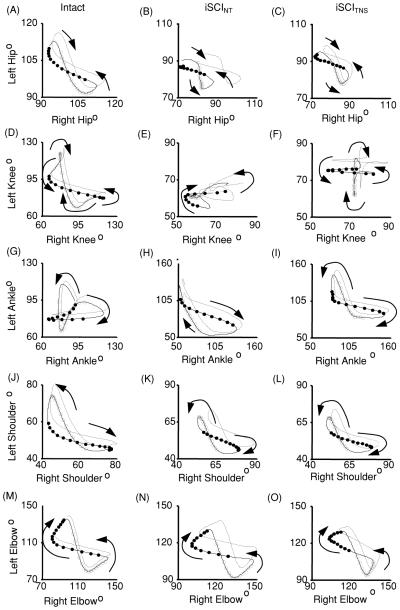
Figure 6.
Group average contralateral interlimb coordination for rats with no injury (Intact) and injured rats receiving no therapy (iSCINT) or receiving NMES therapy (iSCITNS) at 14 days post-injury. Angle–angle plots show coordination between contralateral hips (A–C), knees (D–F), ankles (G–I), shoulders (J–L), and elbows (M–O). Dark lines depict averages while the dotted lines represent the standard error of the means. Averaged traces indicate the swing phase of the left limb (open circles) and the swing phase of the right limb (filled circles). Each circle is separated by 8.33 ms. Arrows indicate the direction of the curves over time.

