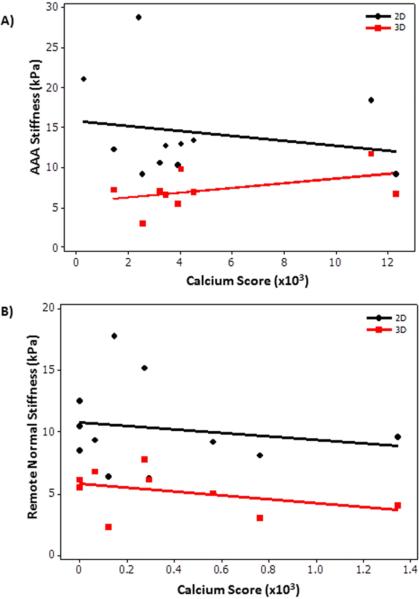
Figure 7.
A) Plot of AAA stiffness as a function of calcium score in the AAA region showing no significant correlation −0.26 (2D) and 0.25 (3D) with a p-value >0.43. B) Plot of remote normal caliber aorta stiffness in AAA patients as a function of calcium score in the remote region showing no significant correlation −0.22 (2D) and −0.45 (3D) with a p-value >0.2.

