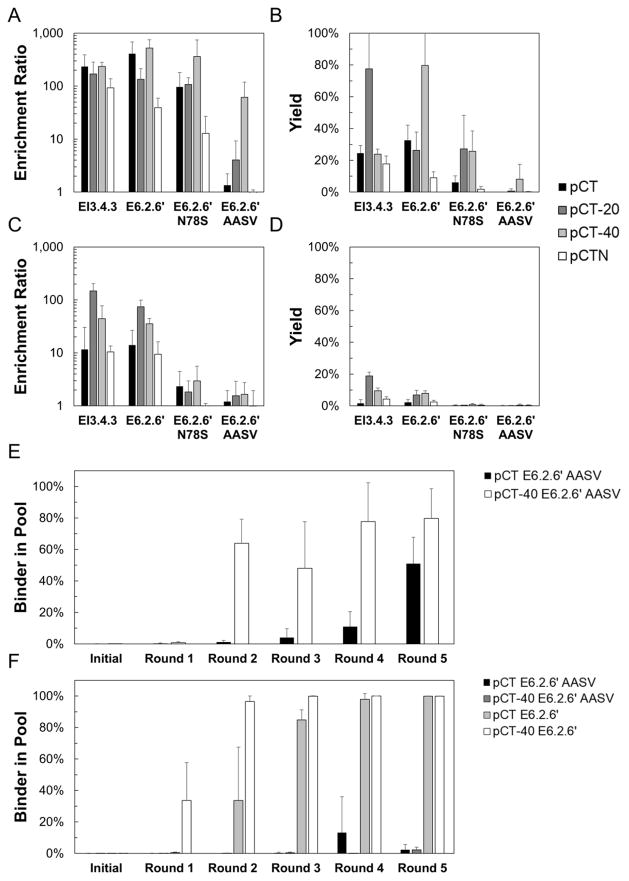
Figure 7. The effect of varying linker length and display orientation on enrichment and yield.
Yeast displaying EI3.4.3, E6.2.6′, E6.2.6′ N78S, and E6.2.6′ AASV mixed 1:1,000 with non-displaying yeast were panned against MDA-MB-468 (A, B) or MDA-MB-231 (C, D). C-terminal fusions (Aga2p-Fn) with the native linker, +20 linker, and +40 linker, as well as the N-terminal fusion (Fn-Aga2p) were tested. The enrichment (A, C) and yield (B, D) of binding ligands is presented as the mean ± standard deviation of 6–12 replicates. Yeast displaying E6.2.6′ or E6.2.6′ AASV as C-terminal fusions with the native linker or +40 linker were mixed 1:1,500 with WT′ displaying yeast in the native linker or +40 linker. Mixtures were panned in triplicate against MDA-MB-468 (E) or MDA-MB-231 (F) monolayers for five rounds. After each round, the fraction of yeast harboring the binding ligand was quantified using quantitative PCR.

