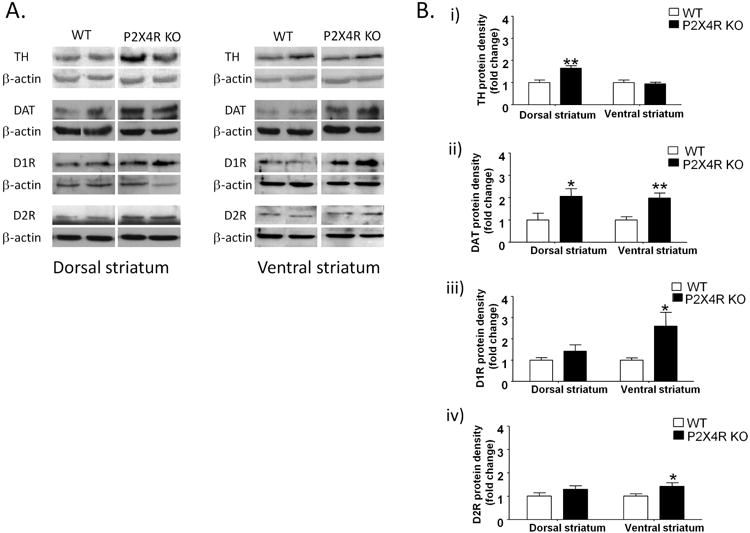
Figure 1.

P2X4R KO mice exhibited significant increases in TH protein density in the dorsal striatum, but no changes in the ventral striatum [A & B (i)]; increased DAT protein density in both parts of the striatum [A & B (ii)]; increased D1R [A &B (iii)] and D2R [A&B (iv)] protein densities in the ventral, but no change in the dorsal striatum. The protein levels of DA markers were normalized to β-actin and expressed as arbitrary units (AU). The average of densitometry value of WT samples was arbitrarily normalized to 1. P2X4R KO samples were normalized by dividing each value by the average of WT samples and presented as fold change of P2X4R KO versus WT in that membrane. Values represent mean ± SEM from 5-8 WT, 7-8 P2X4R KO mice for TH, DAT analyses and 11-12 WT, 12-13 P2X4R KO for D1Rs and D2Rs analyses. 2 representative bands from each genotype from the same membrane are shown. *P <0.05, ** P <0.01 versus WT controls. Unpaired Student's t-test
