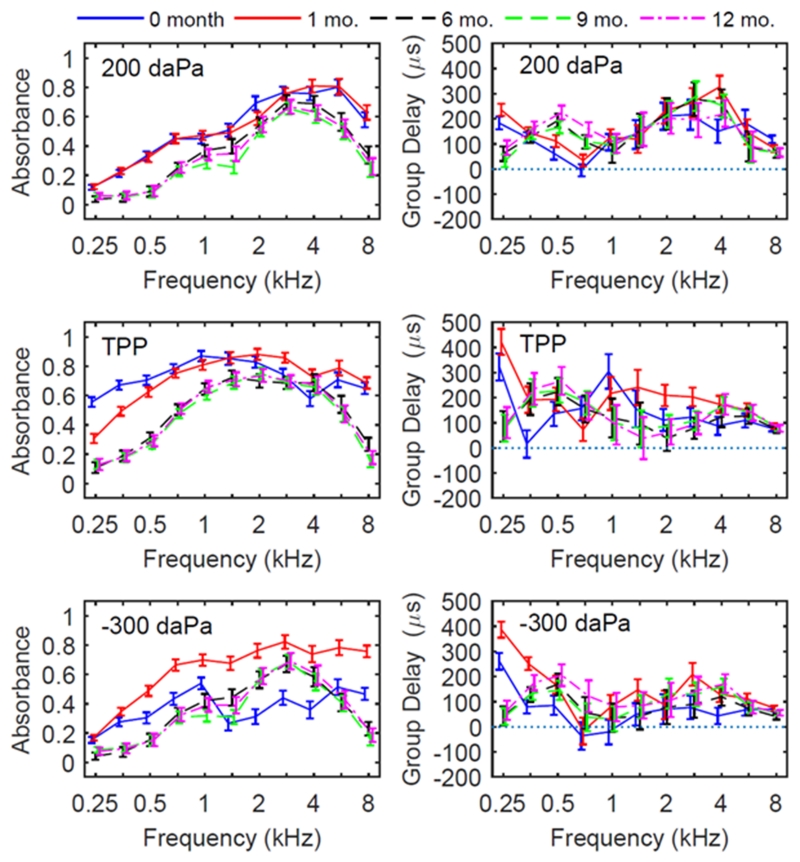
Figure 3.
Downswept tympanometric absorbance (left panels) and group delay (right panels) for each age group, with model estimated mean and 95% CIs. Measures were taken from the ear-canal induced pressure, as noted in the top left of each panel. The direction of pressure change for tympanometry was from positive to negative pressures (downswept).

