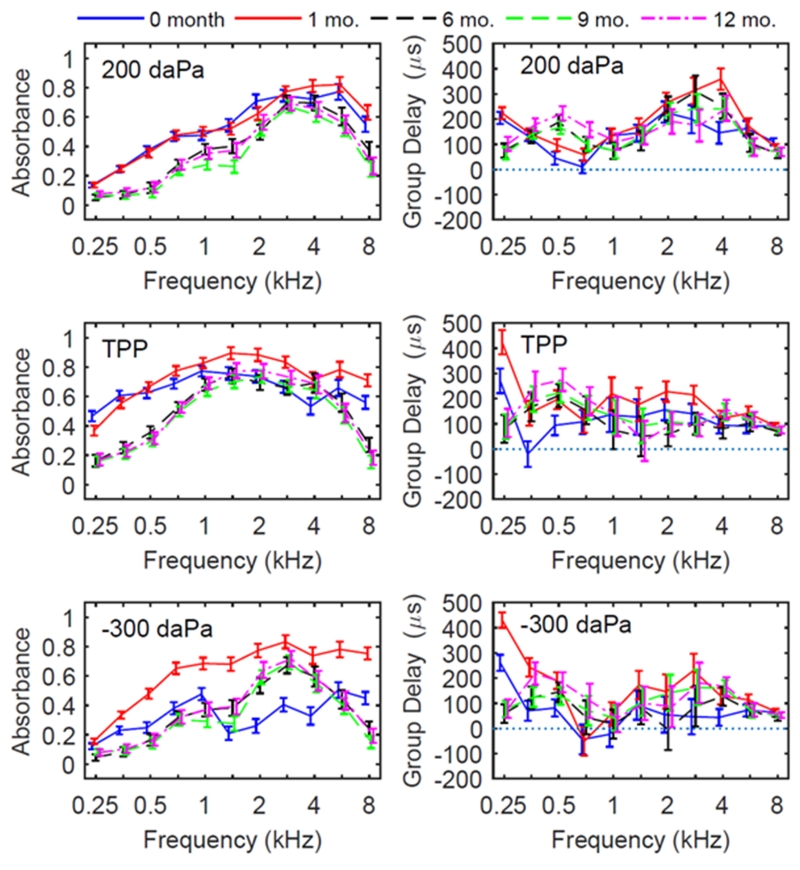
Figure 4.
Upswept tympanometric absorbance (left panels) and group delay (right panels) for each age group, with model estimated mean and 95% CIs. Measures were taken from ear canal induced pressure, as noted in the top left of each panel. The direction of pressure change for tympanometry was from negative to positive pressures (upswept).

