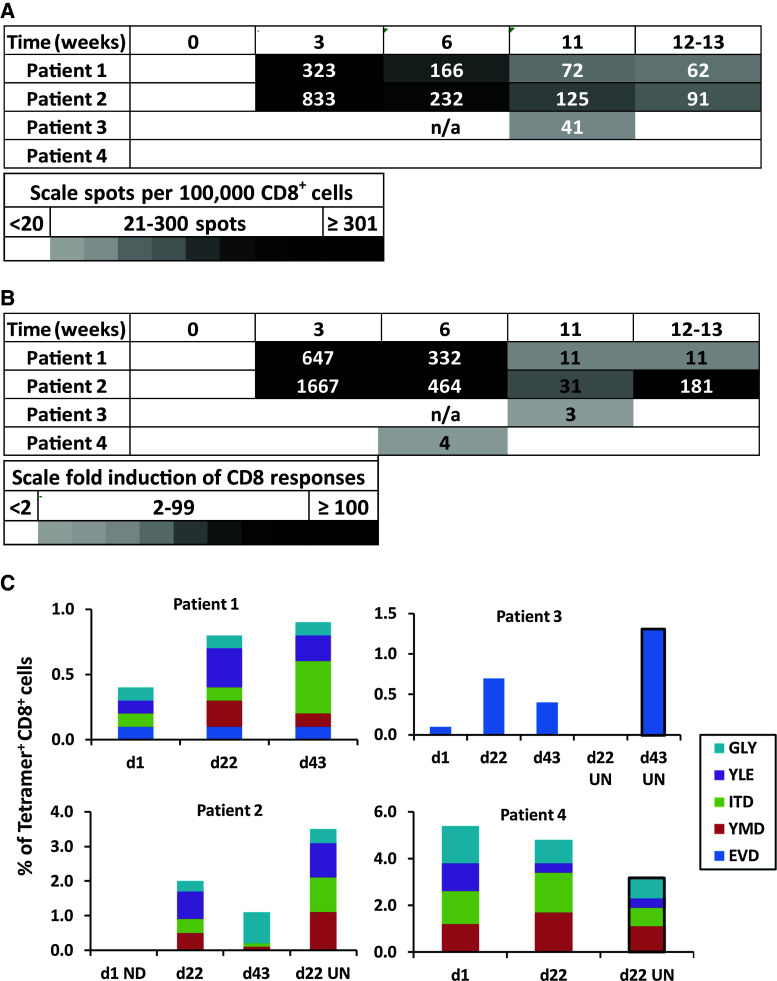
Fig. 2.
Patients receiving 12 MP vaccination generate tumor-reactive T cell responses. Heat map depicting the number of CD8+ cells (per 105 cells) producing IFNγ after stimulation with 12 pooled melanoma peptides, after subtracting negative control values (a), and the fold induction of IFNγ CD8 responses, relative to negative controls (b). A response required increases by at least a twofold and at least 20 spots per 100,000 CD8+ T cells. c Graphs depicting the percent of MHC-tetramer+CD8+ cells from patient tumors at day 1 (untreated), day 22 and day 43 (imiquimod treated), and day 22 and day 43 untreated tumor controls denoted UN. D1 untreated tumor controls were unevaluable for patient 2. When available, tumors not treated with imiquimod were assessed and are marked “UN” with black border added around the bars

